
BTCUSD (Coinbase)
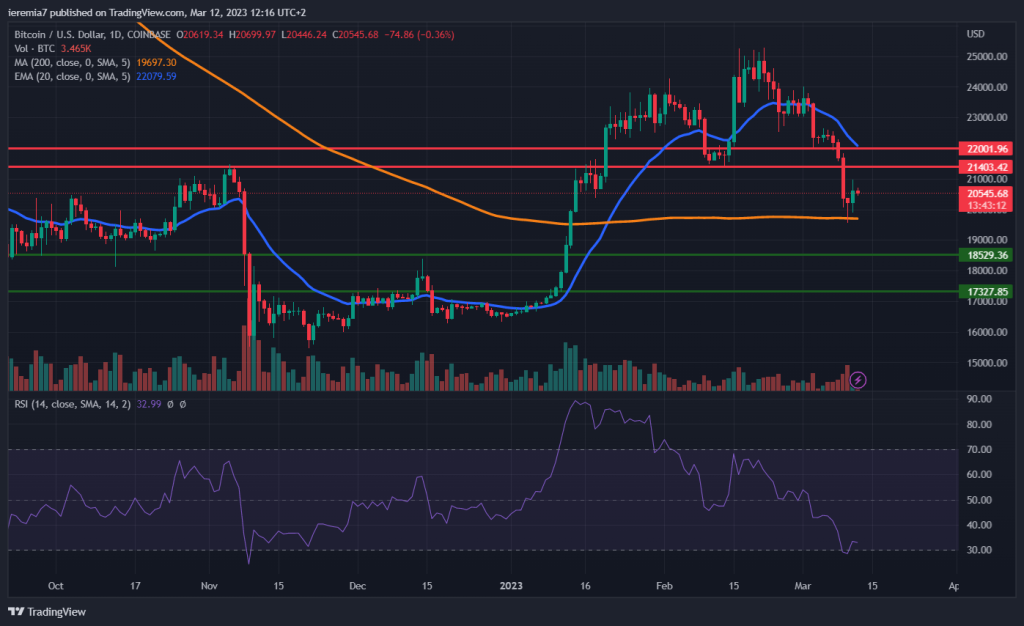
This has been another bad week for crypto buyers, considering BTC continued to edge south. The fallout of SVB, a regional bank from California spooked the broader financial markets, triggering a flight to safety. Volatile assets such as Bitcoin can’t outperform in such an environment, which is why we have bearish expectations heading into the next week.
From a technical perspective, the breakout below $21,400 support is now a clear indication the market structure shifted in favor of sellers. That’s why we suspect that level combined with $22k should act as a strong overhead resistance area.
The daily 200 SMA did act as support yesterday, but thus far buying is contained. The real challenge for that area would be once all markets open on Monday. If the bearish move continues to move below the moving average, $18,500 and then $17,300 will become our downside targets. It’s a tough spot for both sides of the market. Buyers need to wait for a bottoming confirmation on smaller timeframes, while sellers are vulnerable in the face of upside rips, considering the price is already oversold.
ETHUSD (Kraken)
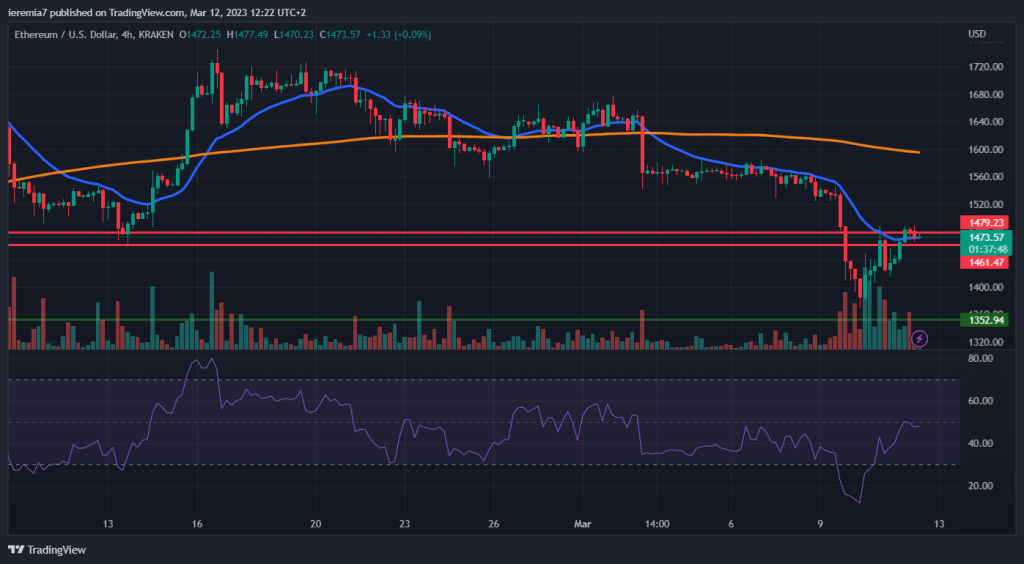
Similarly, ETH broke below the $1,460- $1,480 key support area, yet we can see the weekend bounce is stronger in this case. The price is encountering resistance around the 20 EMA on the 4 chart, which is why we believe there’s scope for weakness as the new week kicks in.
Below, $1,400, buyers could look for opportunities to get long around $1,350 and then $1,250. The string of lower lows and lower highs suggests we are in a market driven by sellers. That will be the case until the price action structure changes.
We need to see Ether breaking above the 20 EMA substantially and then head towards $1,600, where the 200 SMA is currently trading. Only after a break above it happens, we can suggest a change in market sentiment occurred. Until then, Ether is vulnerable to selling the rips.
LTCUSD (Coinbase)
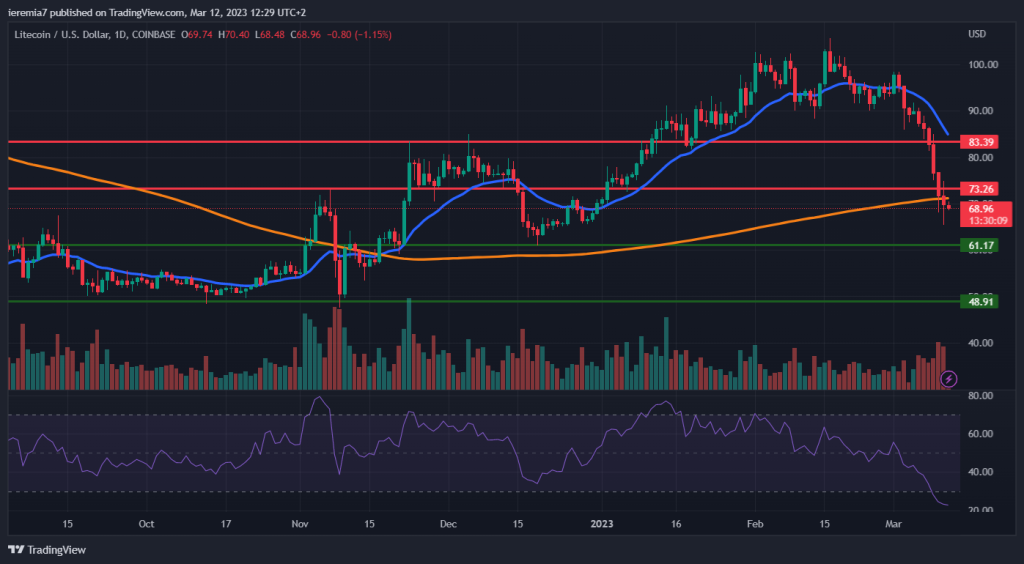
Litecoin is trading down 24% for the past 7 days and now threatens to break below the 200 SMA on the daily chart. Although dip buyers managed to contain the selling yesterday, the biggest picture doesn’t look favorable for them. We can see 6 consecutive days of heavy selling and even a bounce up is expected to be followed by renewed selling pressure.
The first downside target is $61 and if the move continues to extend lower, buyers have a higher chance of rotating the price higher around $48. LTC has been selling on rising volume and that’s another sign of concern, showing market participants are dumping tokens.
Our bearish view will change only after Litecoin breaks above the daily 20 EMA and starts treating it as support, instead of resistance. It is essential to see the downside capped in the current location and above 200 SMA if the theory of a bottom would be the right one. Unfortunately, if markets will be on edge next week, that will be a green light for further crypto dumping.


There are no comments at the moment, do you want to add one?
Write a comment