
BTCUSD (Bitstamp)
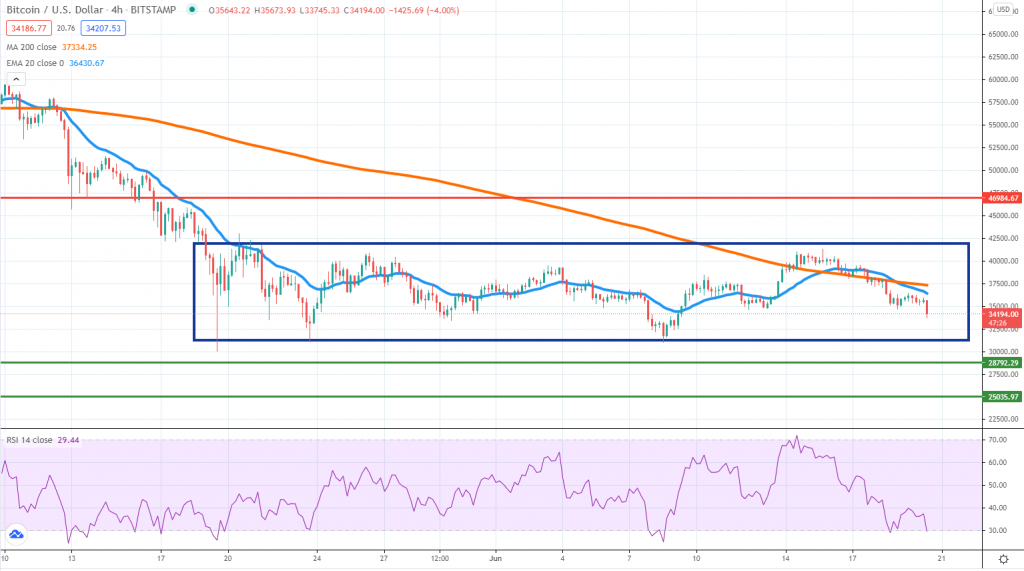
Source: TradingView
Bitcoin stumbled into strong resistance around $40,000 and had been rolling off for the past several days. Downside pressure on stock markets, combined with a rising US dollar, both acted as a headwind for BTC and now we see the token heading back to the $31,000 area.
It seems like the price is locked inside a range between $31k and $42k, which means the next impulsive move won’t materialize until a breakout occurs. Same as during the past few weekends, we see Bitcoin selling intensifying. Moves are aggravated by lower liquidity conditions and market participants should vary of false breakouts.
A break below the May 19th low will be a sign of weakness and could mean Bitcoin will revisit $29,000 or even $25,000. Buyers, on the other hand, will need to keep the price inside the range and push it back towards the 4h chart 200 SMA, where the closest resistance area is located. The overall BTC picture looks awful and buyers will need to step up their game if they want to prevent a further slump.
ETHUSD (Kraken)
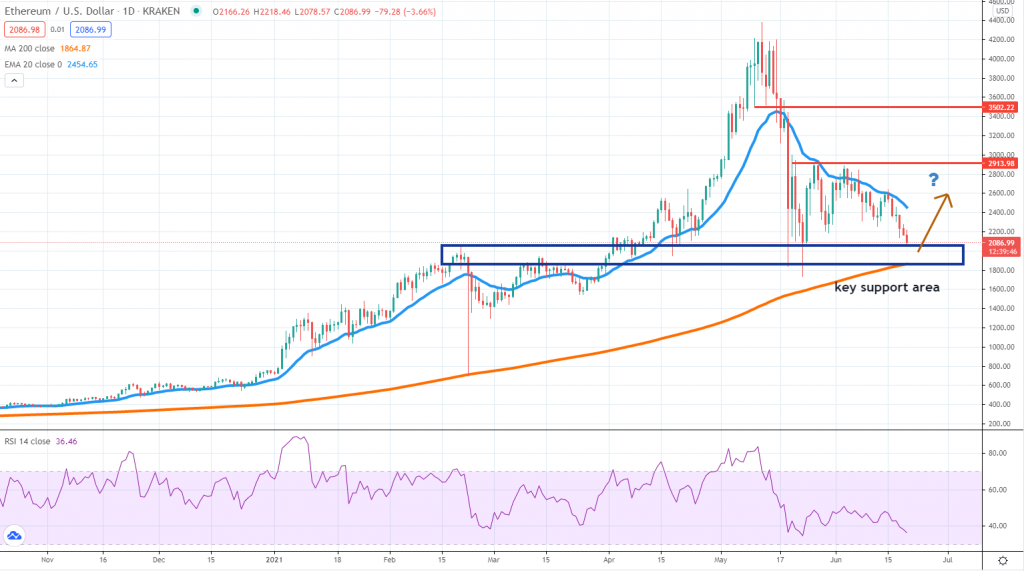
Source: TradingView
Five of the past six daily candles are red, showing ETH is in the same delicate spot as Bitcoin. The price trades below the daily 20 EMA and continues to treat it as resistance, which means the next pivot point might be located around the highlighted area on our chart.
There is where the former all-time high around $2,000 is located and at the same time, the place where the daily 200 SMA kicks in. It is yet another key indicator watched by many market participants and the last time it was reached (February this year), it led to a massive buying spur.
We don’t know if that will materialize once again, since now the selling pressure is more severe. The daily RSI is closer to the oversold conditions, which means the extremely overbought price action structure changed completely during the past several weeks. Valuations are way more attractive now, but buyers don’t look eager to buy the dip.
BNBUSD (Binance)
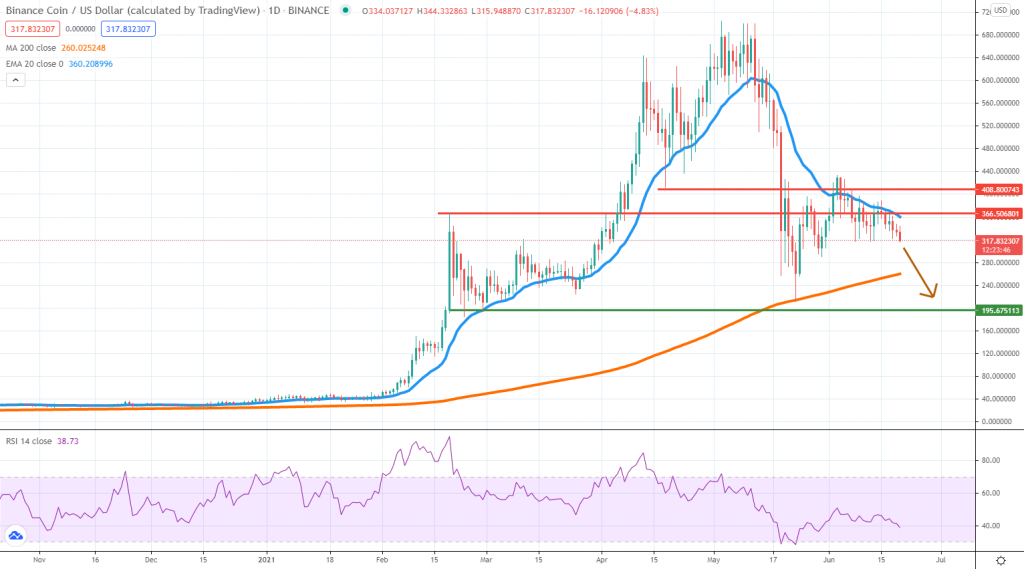
Source: TradingView
Binance Coin had been surging to record-breaking level as the broad crypto bull run extended and now the exact opposite is happening. The negative sentiment weighs on price and had recently led to an important technical shift.
After treating the area around $370 – $410 as support, the price broke below it and is now unable for another push higher. We’re dealing with a role reversal level as long as buyers don’t step in aggressively and drive BNB higher.
If conditions won’t change, we expect BNB to continue to roll over towards the daily 200 SMA and on a break lower, towards the key $200 psychological area. We can start to question if this is a head and shoulders pattern, that could lead the price back to February lows.
Only if the price breaks above $430 should the short-term sentiment shift and buyers gain more confidence. Now the bubble is bursting and the price action moves can overshoot on the downside, same as they did on the upside.


There are no comments at the moment, do you want to add one?
Write a comment