
BTCUSD (Coinbase)
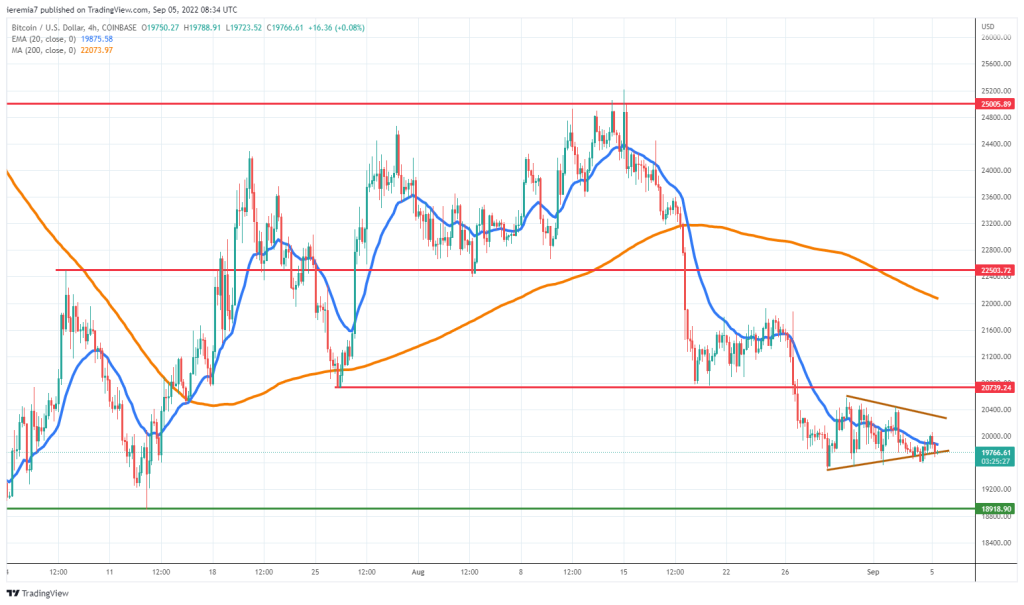
Conditions have not changed with Bitcoin and even if the price has been consolidating over the past week, the sellers are still the ones in control. Right now we see BTC attempting to break below a short-term triangle formation and the probability favors a continuation lower.
Low appetite for volatile assets means Bitcoin should revisit the $19,000 area once again, for the first time since mid-July. Failure to cap the downside will mean buyers are in for more pain, given the price could go much lower, towards $15,000.
September is not a good month from a seasonal perspective, especially if the US Dollar and yields will continue to move higher. Bitcoin must break above $20,500 to suggest that a slight improvement in sentiment occurred.
We still favor the downside and advise those that are looking to get long-term exposure to remain patient since valuations could be more attractive a few days or weeks from now. Technicals rule the game and as long as the price will treat the 4h chart 20 EMA as resistance, there’s little hope for a strong bullish pullback.
ETHUSD (Kraken)
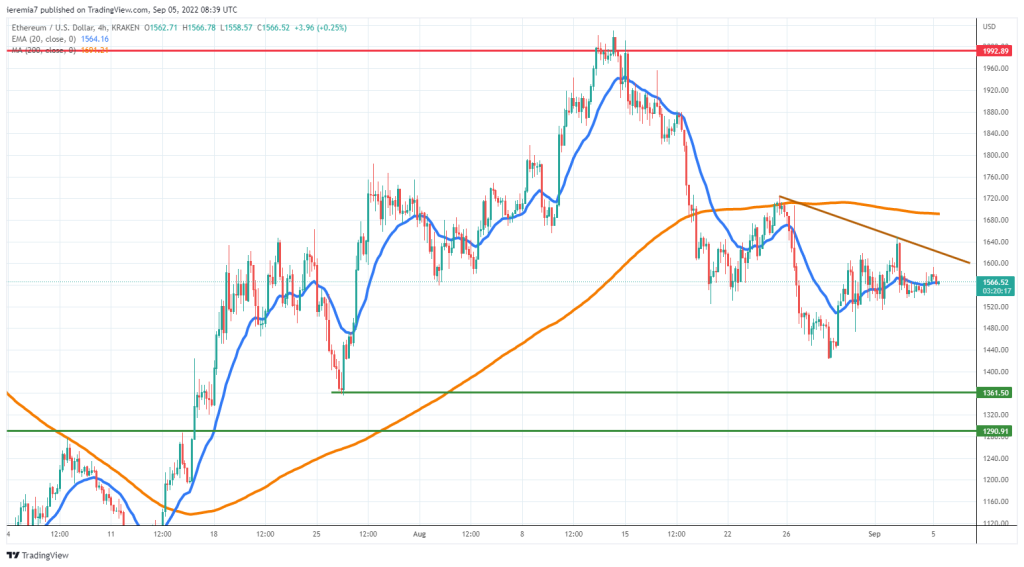
Once again we notice Ether outperforming Bitcoin, given the 10% jump in price noticeable over the past week. However, the poor market sentiment did not favor a continuation higher and the price is now under selling pressure.
A short-term descending trend line emerged and while the market respects it, we believe there is room for more weakness. Breaking below the 20 EMA impulsively will mean ETH is bound for a retest of $1,400, where the current move up started.
Lower lows and lower highs on the 4h chart suggest the pressure persists and $1,360 remains a target for the near term. That is where ETH started to rise impulsively at the end of July and it might be the case to see that area as an attractive place to buy.
Breaking above the trend line on the chart does not mean buyers are out of the woods, since the 200 SMA also proved to be strong resistance. Overall, the downside is still favored, but bounces should be stronger in this case if the broad sentiment improves.
MATICUSD (Bitstamp)
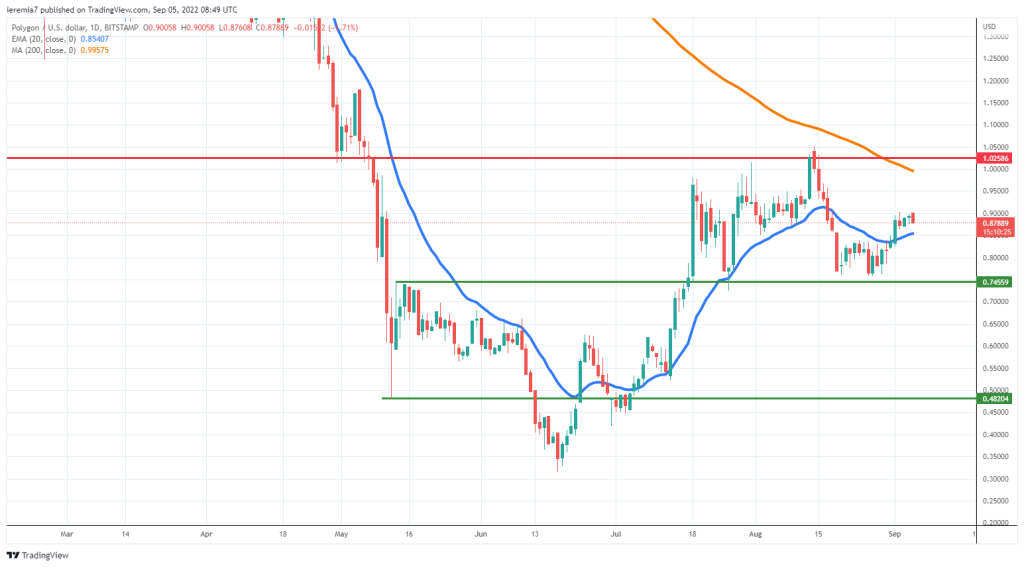
One of the major performers last week was Polygon, but when looking at the bigger picture, there is still a cloud of uncertainty, even if the token managed to stage an impressive rally since mid-June.
A worrying sign is that sellers capped the upside around $1 a key psychological area and also a technical level to watch by both sides of the market. As long as the buyers are unable to drive the price above it, the sentiment remains tilted in favor of sellers.
Right now the price is hovering around 90 cents and if the bullish sentiment persists, a retest of $1 should not be ruled out. The daily 200 SMA will also come into play, so expect a lot of choppiness around it.
On the downside, renewed selling pressure could drive MATIC towards 75 cents, where buyers showed willingness to enter the market in the past.


There are no comments at the moment, do you want to add one?
Write a comment