BTCUSD (Coinbase)

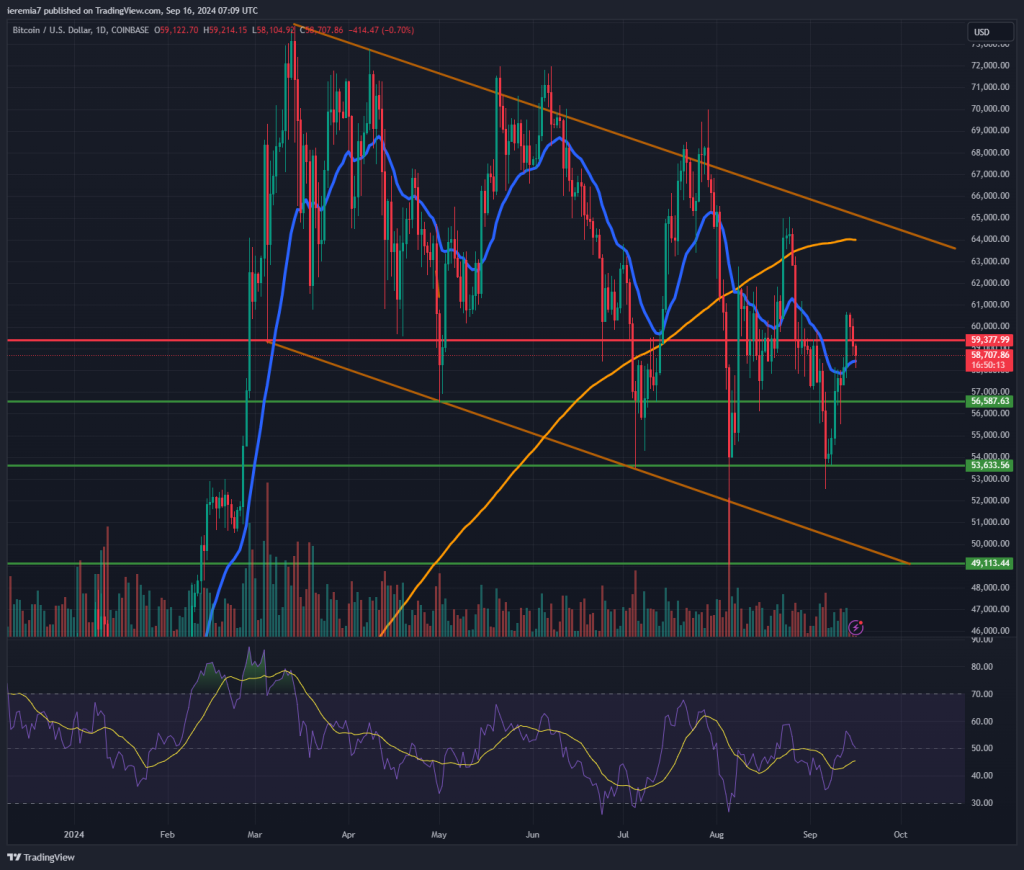
We had a short-term rally last week, yet Bitcoin failed to hold above $60k. It’s important to note that the second half of September is the most bearish period of the year, so we should expect to see weakness until the October bullish seasonality kicks in.
As we’ve said in the past, seasonality is not always 100% accurate, meaning traders need to watch the price action performance. BTC did break above the daily 20 EMA, but that’s not enough to negate the bearish vibe.
The price is still below the daily 200 SMA and inside the bearish channel formation. The RSI has also swung back and forth around the 50 area, confirming the lack of directional bias. Those interested in going long might want to look for opportunities around $56.5k or $53.6k. Buyers could resume around these swing points.
A continuation higher than last week’s highs will mean that Bitcoin could be on its way to retest the 200 SMA + the $64k area. That is expected to act as resistance and only an impulsive break above it will suggest the bullish trend resumed. We have the FOMC meeting this week, which should be closely watched as risk sentiment can shift around these events.
ETHUSD (Kraken)

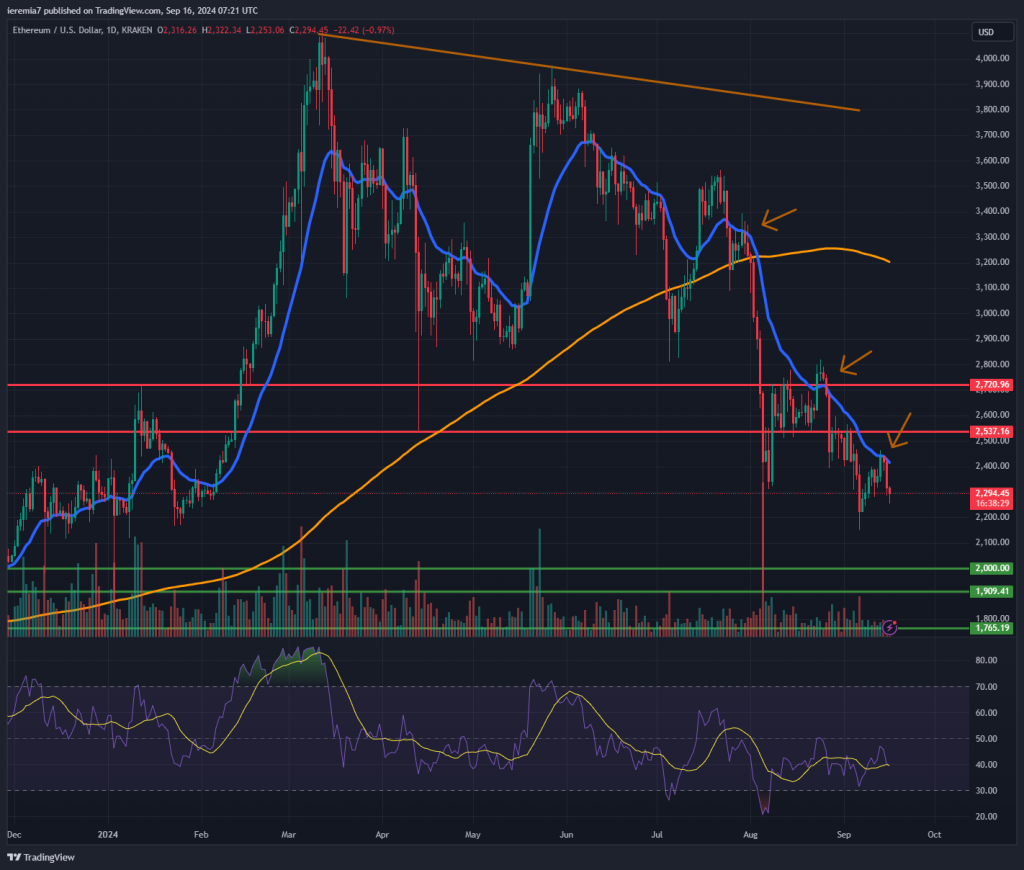
Ether’s relative weakness to Bitcoin continues as we see the price consistently rejecting the daily 20 EMA. That’s a bearish sign and might indicate there’s more pain ahead before buyers step in at a solid pace.
Most of our key levels are unchanged compared to last week. If the price continues to weaken below the $2,150 mark, then the next likely target will be $2,000 – $1,900. We view that as a stronger pocket of support, where a bounce has a high probability of starting.
That doesn’t mean the bearish move is over. Looking at the bigger picture, there is a bearish parabolic structure that still is in play. The market has to break above the 20 EMA, treat it as support instead of resistance and then clear out other resistance levels. Two of the most notable ones as $2,500 and $2,700.
TRXUSD (Bitfinex)

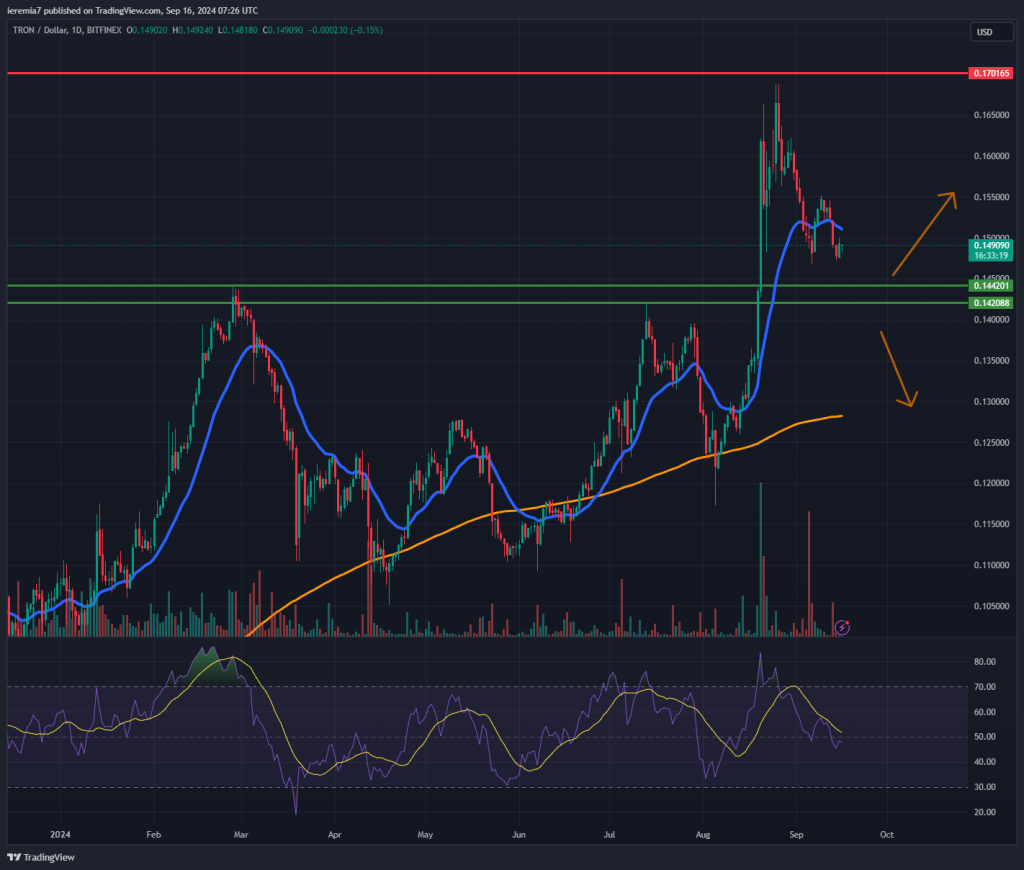
Tron has been under pressure as well since August 26th, but the bigger picture continues to be bullish. We are including this token in our weekly analysis simply because the price is getting close to an important area on the chart.
The 14.2 – 14.4 cents is a role reversal level and a zone where buyers should step in aggressively. If that will be the case, then we expect Tron to head up to 15.5 cents first. Clearing out that minor resistance will open more room for a retest of the August highs and 17 cents resistance.
All options are on the table, so the bearish scenario shouldn’t be neglected. An impulsive break below the role reversal area mentioned above will be a bearish sign and TRX could be headed to the daily 200 EMA, located around 13 cents right now. We see the market retested the orange line several times since April 2024.


There are no comments at the moment, do you want to add one?
Write a comment