
BTCUSD (Coinbase)
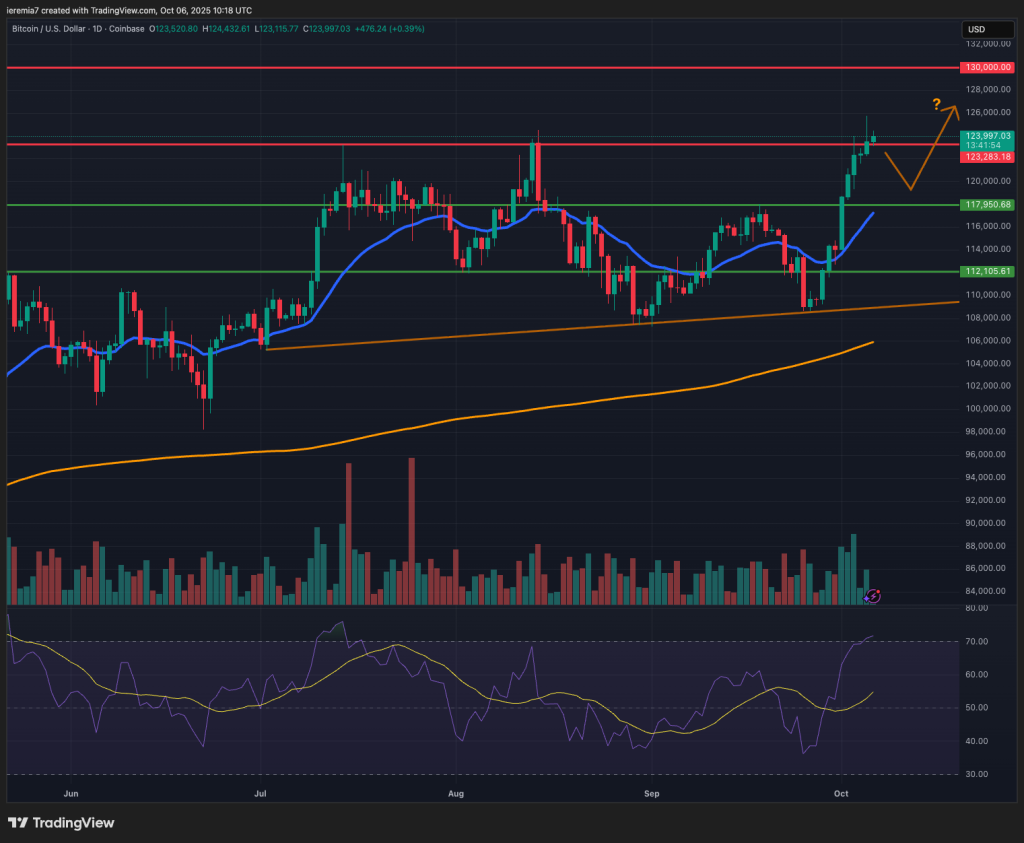
The start of October is in line with seasonal patterns, considering Bitcoin momentum gathered pace for several days in a row. It also managed to reach a new ATH yesterday, before retracing to the $123k key level.
Only 2 of the last 10 closed candles on the daily chart ended red, suggesting the buying pressure is solid. As a result, we think this rally has legs and could extend further. The US Dollar and yields are rising to start the new week, but the moves are not exaggerated.
We could see a pullback towards the $118k – daily 20 EMA area and we think that’s a buyable dip. Our next upside target is $130k, a psychological level where some traders are likely to take some profits. When faced with an uncharted terrain, these round numbers tend to work well as resistance.
On the downside, we need to see Bitcoin break impulsively below $118k. Even in that scenario, sentiment will shift to bearish only if the market drops below $110k. That’s not the most likely path forward, given flows are so favorable right now.
ETHUSD (Kraken)
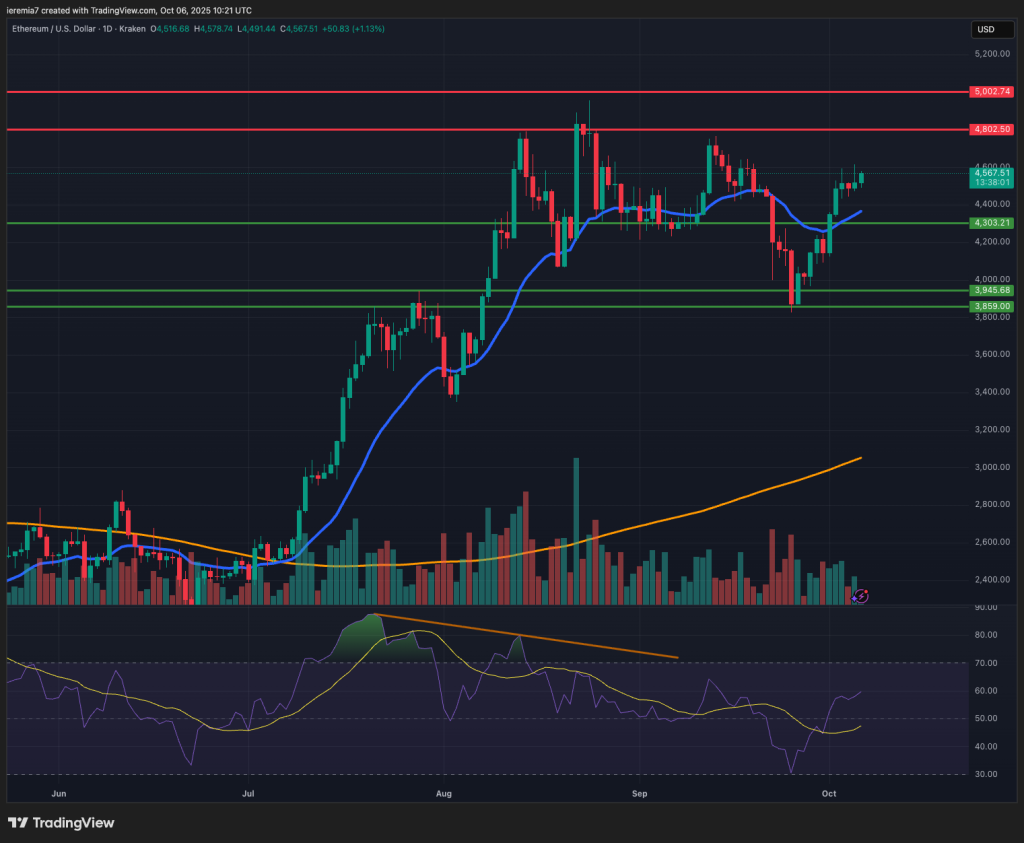
Ether is underperforming BTC since it hasn’t reached a new all-time high thus far. However, the sentiment has improved after testing our $3,950 – $3,850 key support area. The price is now trading above the daily 20 EMA and the RSI is not yet overbought.
The market has upside if the momentum keeps building this week. We see support at the 20 EMA and $4,300, so as long as the price manages to stay above, buyers hold the upper hand. In this scenario, we see $4,800 and $5,000 as the next likely targets. Bear in mind that when the price reaches new highs, follow-through buying usually occurs, which leads to an overextension of the move.
Traders shouldn’t rule out a dip lower. We will shift to cautiously bearish if the price breaks below $4,300 and doesn’t show signs of recovery. If that is the case, the next likely target will be the $4,000 area.
LTCUSD (Coinbase)
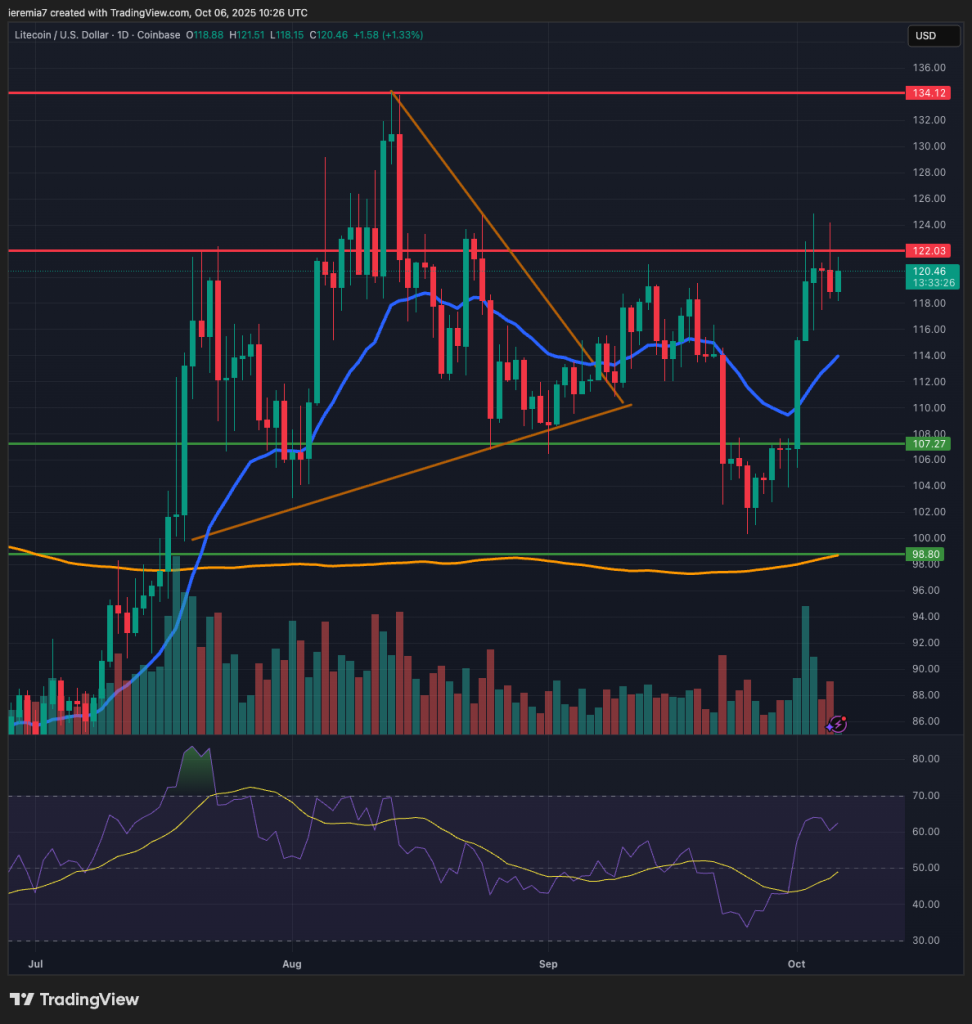
Looking at Litecoin, we see how buyers were trapped once the price broke outside a triangle formation. However, the selloff was short-lived and now the market has managed to recover. We see some selling around $122, a key swing point, but that doesn’t seem enough to turn the tide.
For that reason, even if the price can weaken further from here, we recommend buying as long as the daily 20 EMA is below the market price. That will show weak selling activity and could suggest further gains on the upside.
We think LTC can reach $134 during the next couple of weeks if the bullish sentiment persists. This is the likely scenario, considering October and November are usually bullish months for the crypto space. Impulsive selling below the 20 EMA will mean $107 support could be back into play. We shift to a bearish stance only if Litecoin breaks below $100.


There are no comments at the moment, do you want to add one?
Write a comment