
BTCUSD (Coinbase)
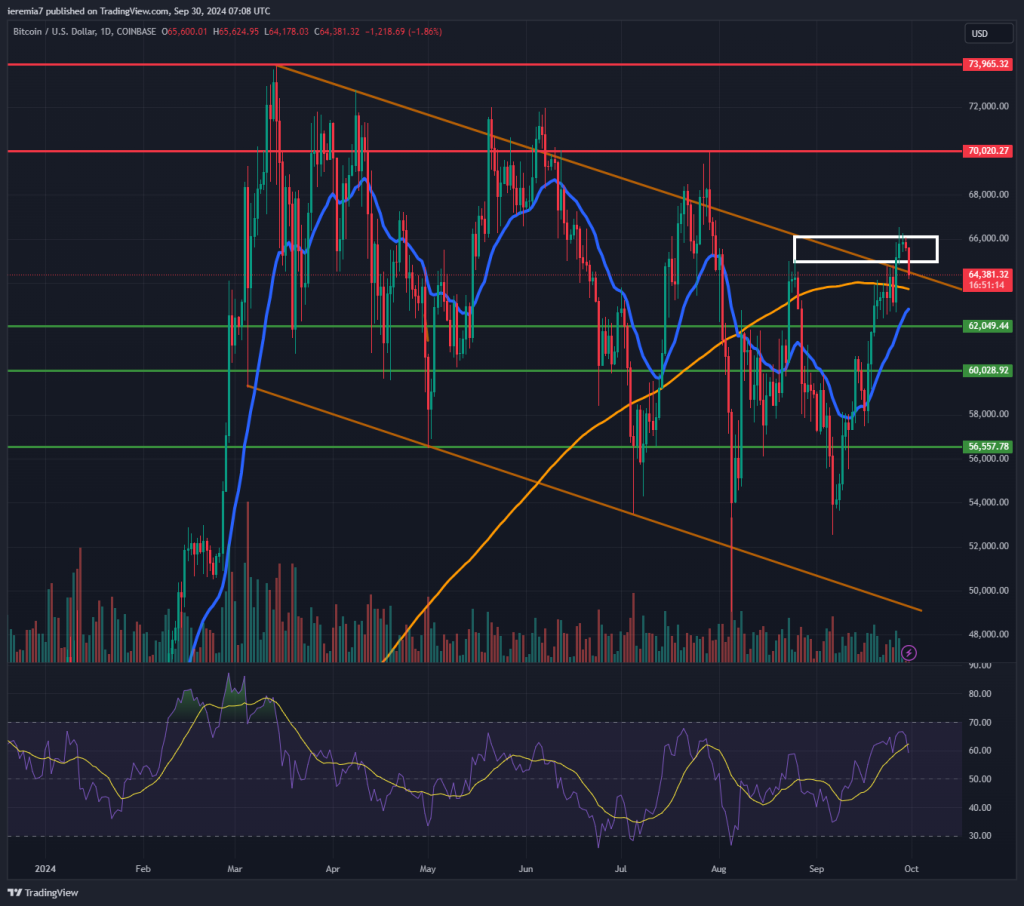
Our bullish tilt from last week turned out to be true since Bitcoin continued to move up and temporarily breached the consolidation channel. However, we are seeing some weakness to start the new week and that should keep buyers on hold for now.
It could be geopolitics since tensions in the Middle East have escalated. Whether or not that has an impact on BTC during the upcoming days is yet to be seen. At this point, we advise patience. You should see whether the price is able to find support around the daily 200 SMA or the 20 EMA. Also, the $62k and $60k levels are support areas as well.
We need to clear out last week’s high to confirm the channel is broken and more gain will follow. As things stand right now, the next couple of days might turn out to be choppy. If BTC breaks above $70k, the resumption of the bullish trend will be confirmed and then we would expect new all-time highs.
Keep in mind that weakness could still prevail, even though we are entering a bullish period of the year. Seasonality doesn’t always play out and we saw that in September, when Bitcoin should have been under pressure.
ETHUSD (Kraken)
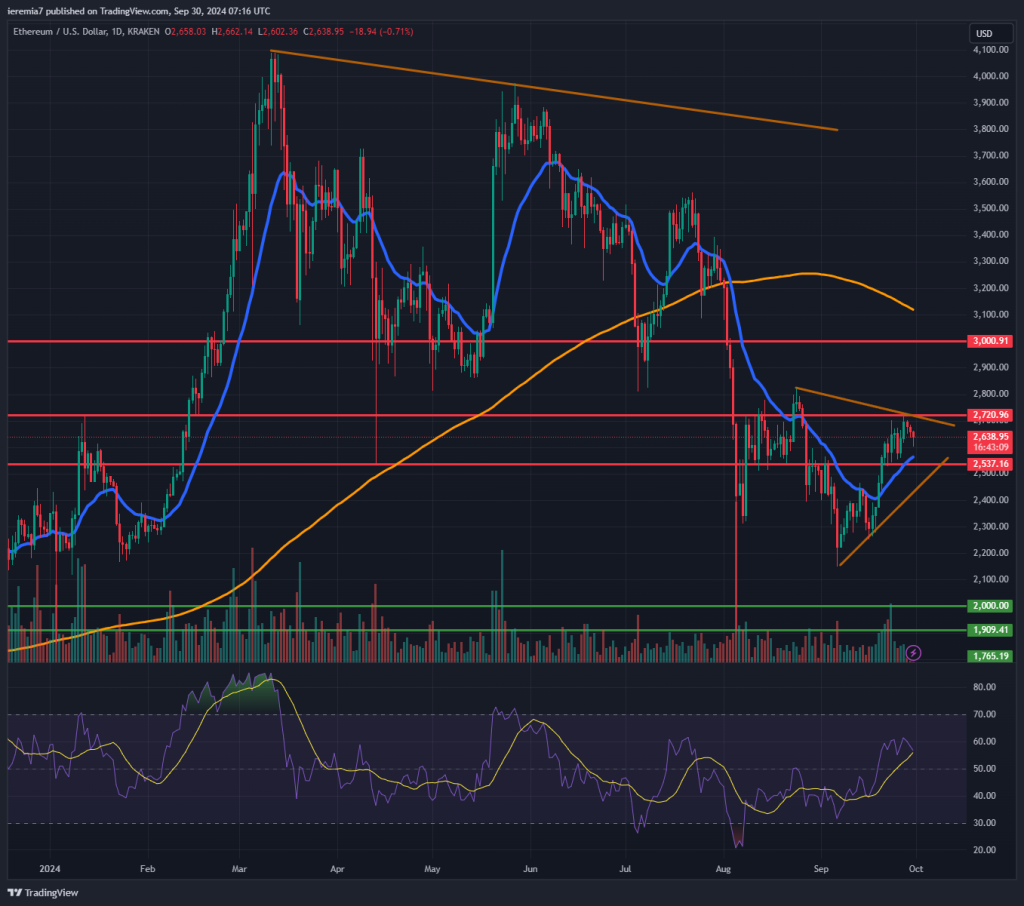
Ether posted small gains last week and we see the coin consolidation inside a tringle pattern. To improve our confidence that the price can march higher, we need to see ETH breaking the $2720 resistance and the triangle pattern.
In that scenario, we see scope for further upside and the next major resistance area to watch would be $3,000. Traders should also consider the daily 200 SMA, which is located a little above that area.
The downside needs to be capped by the daily 20 EMA or the lower line of the triangle. That’s a must to keep the bullish hopes in play. If not, Ether could slide towards the $2,300 and even below that. Accelerated selling will be bearish since that might open more room towards the key $2,000 support area.
XRPUSD (Kraken)
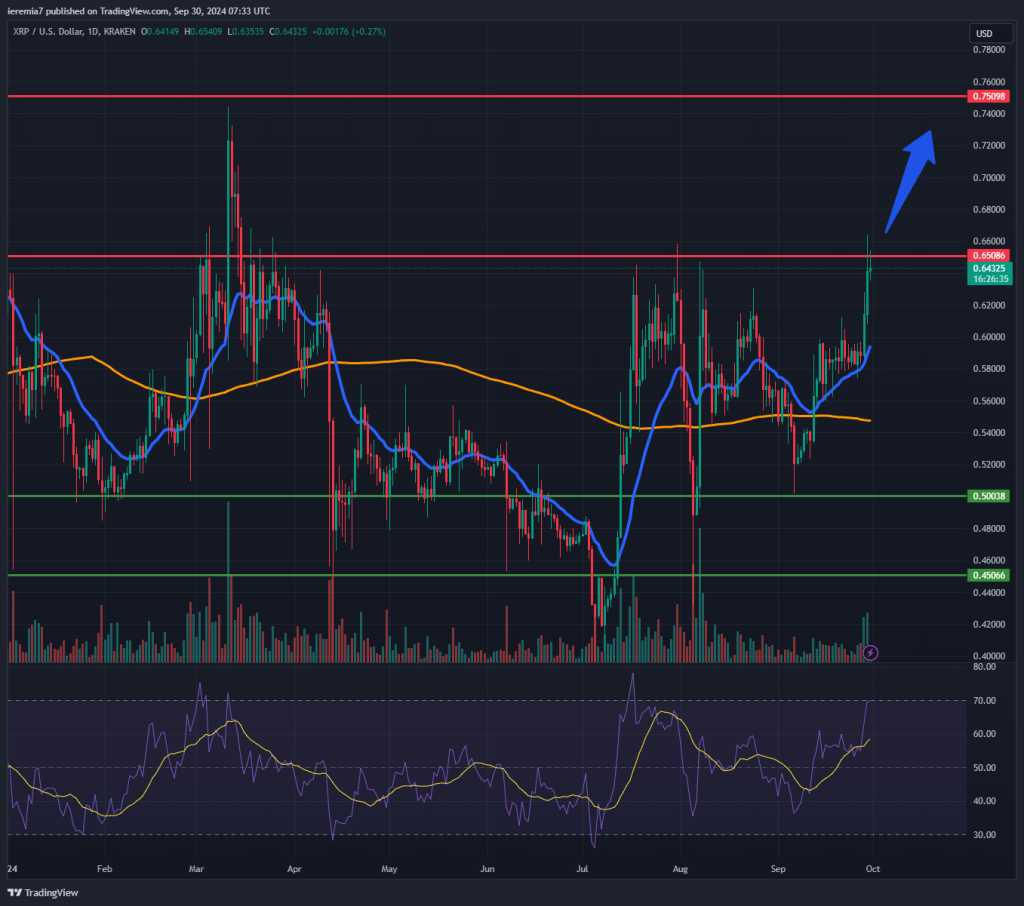
We are adding XRP again to our weekly crypto analysis because the price action is in favor of bulls. More specifically, we see that the price is now pressuring the 65 cents resistance zone and if a break occurs, then the move could extend towards 75 cents.
Things haven’t changed too much for this token, given the price continues to be locked inside a range between 45 and 75 cents. That is a good thing for short-term traders because it unlocks plenty of trade opportunities.
Thus far, it has been a no-brainer – buy around 45-50 cents and sell as XRP was getting close to 75 cents. How long will this range stay in play? We don’t know. However, when the break happens, you should expect a major spike in volatility and follow-through in the direction of the break. Until then, XRP should remain range-bound. We’ll update here again once new developments occur.


There are no comments at the moment, do you want to add one?
Write a comment