
BTCUSD (Coinbase)
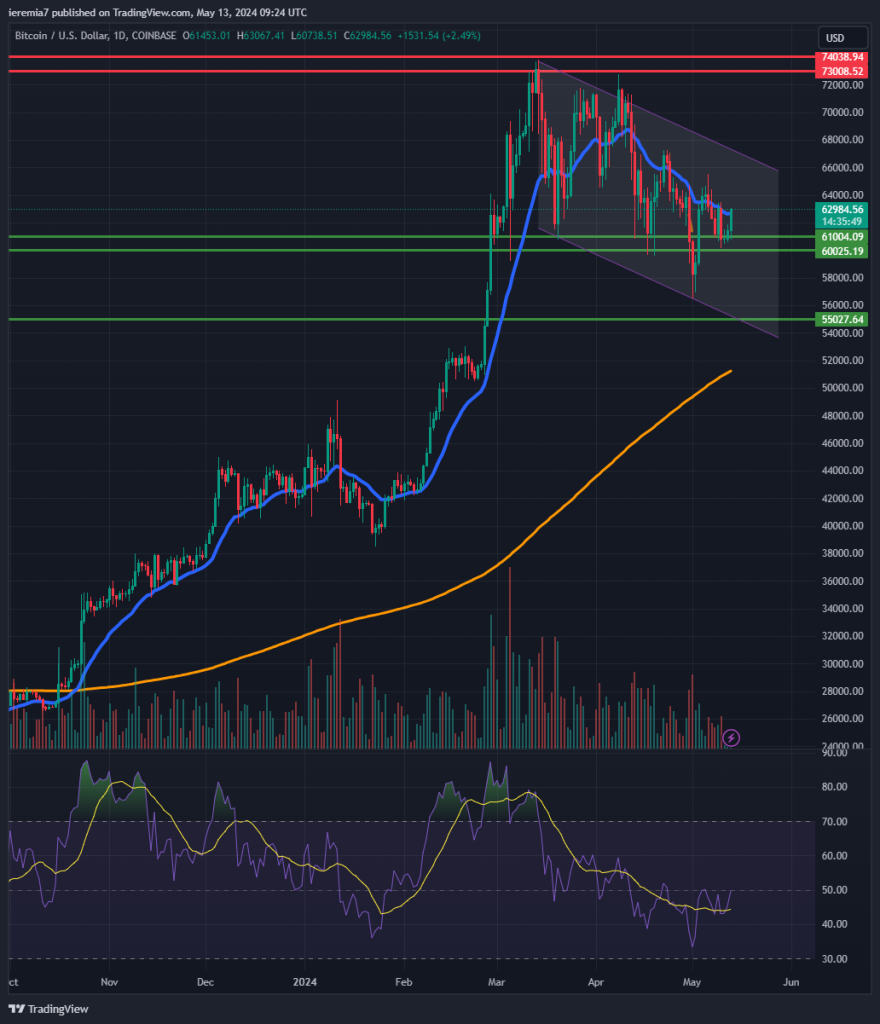
For this week’s crypto analysis, we’re shifting to the daily chart because we want to point out how Bitcoin continues to be in consolidation mode. You can see how the price is trading inside a bearish channel and only after a breakout higher should traders change their sentiment to bullish.
In the meantime, BTC retested the $60k area and it is not showing some signs of strength. While there is no major news in the crypto space, keep in mind that it’s that week when US inflation figures are published. That could have major implications for risk assets, including BTC if the actual figures deviate from consensus.
If Bitcoin breaks above $66k that will be the early sign of strength and in that scenario, we expect the price to continue up towards $73k, or even a new all-time high. On the flip side, as long as the price continues to trade inside the channel, there is always a risk for a dip, even if just temporary.
Markets don’t seem too worried about inflation spiking, so our expectations are bullish, especially for the second half of the week. Still, you should watch for impulsive breaks below $60k, because that’s our risk-off level.
ETHUSD (Kraken)
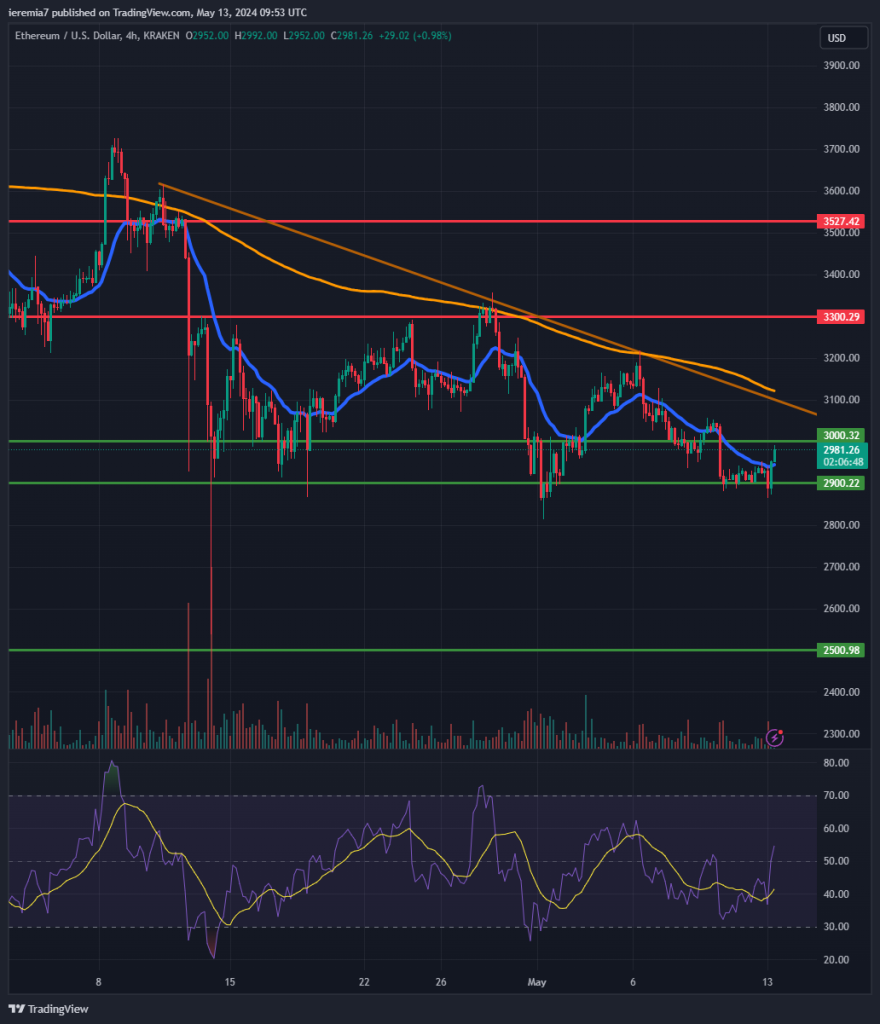
Ether looks to be in a poorer technical position and we say that because the price has tested the $2.9k – $3k area several times, without managing to generate a higher high. In fact, we can see how the price has been constantly rejected by the 4h chart 200 SMA and a falling trend line.
While below those two, we favor the bears and Ether needs to break and hold above $3,100 before we shift sentiment. Only once that happens, buyers can be optimistic about a new retest of $3,300 and $3,500.
In any case, we don’t advise taking any swing trades at this point, since the market is expected to get volatile on Tuesday and Wednesday. The bearish scenario will be triggered once the price breaks below $2,800. That will be a sign of weakness and $2,500 will take the spotlight as the next key support.
TONUSDT (OKX)
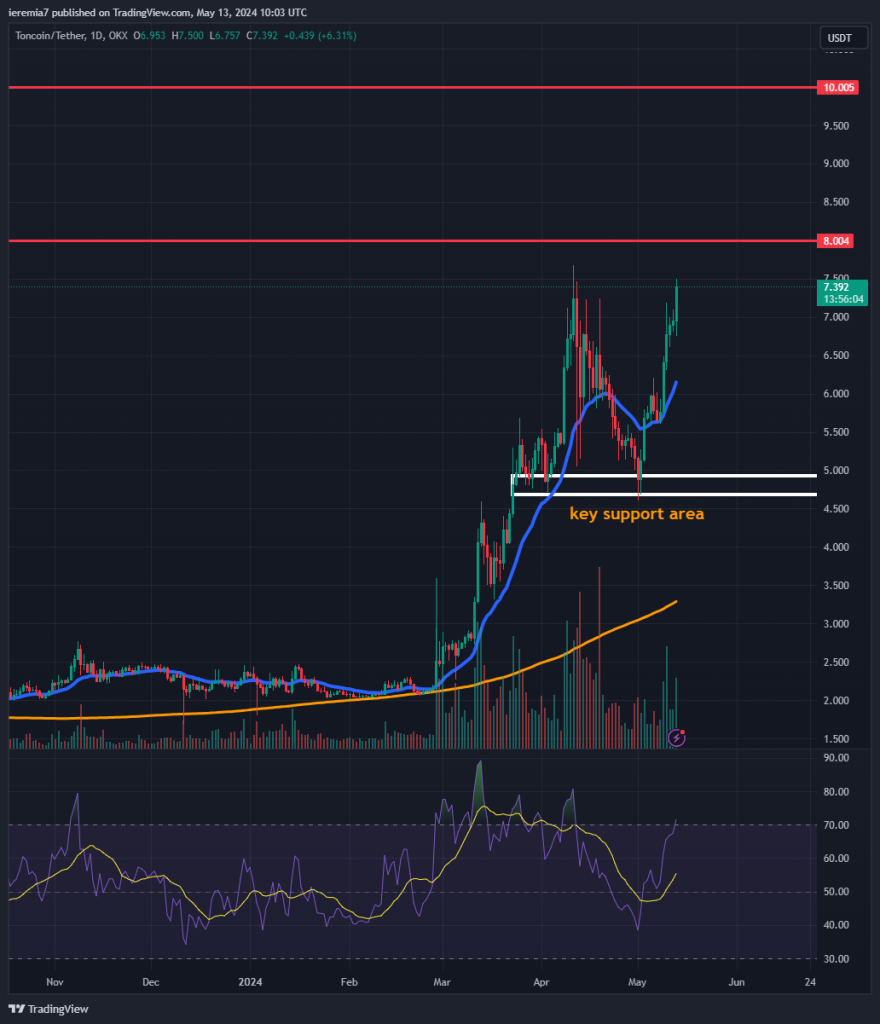
Toncoin is up more than 20% last week after the retest of the key support area around $5 continues to draw in more buyers. The price is close to reaching the April 11th high and as things stand right now, a breakout higher is very likely.
Given we are getting close to uncharted terrain, you should focus on key psychological areas as targets. Two examples are $8, which is very close to the current spot price, and $10, which should act as a stronger resistance area.
All in all, expect more choppiness and volatility as the price attempts to make new highs for 2024. Still, we continue to favor the upside and all dips closer to the daily 20 EMA should act as a buying opportunity. TON is up 6 consecutive days in a row and even if that’s a bit overstretched, it’s not the proper environment to look for shorts.


There are no comments at the moment, do you want to add one?
Write a comment