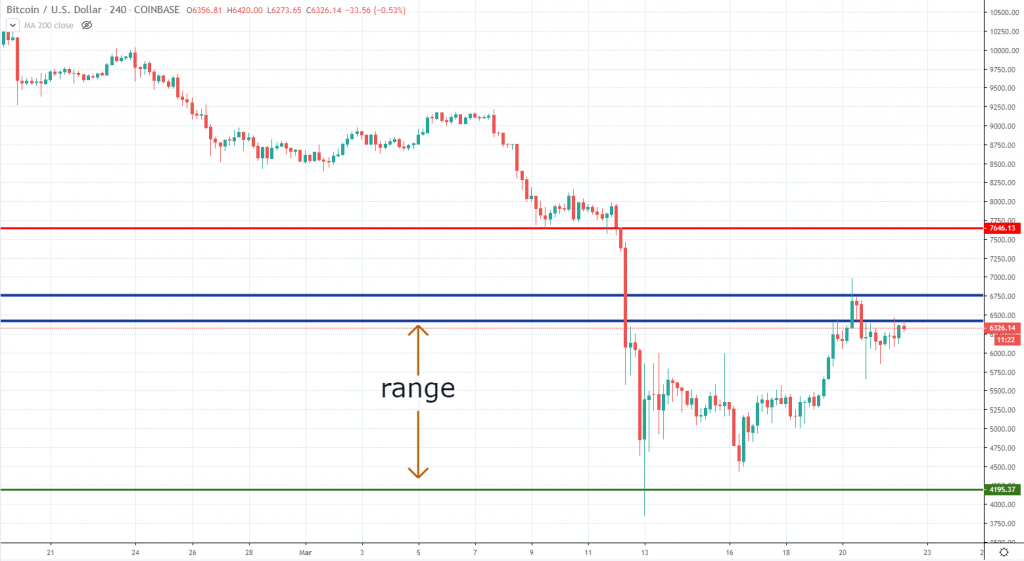
BTCUSD Coinbase

As we’ve anticipated in our last weekly crypto analysis, Bitcoin had rebounded higher, towards the broken December 2019 lows, and then stalled. We can easily notice a resistance area had formed around $6,500-$6,800 and thus far the buyers had not been able to break impulsively above it. How the market sentiment will change is the main key to watch during the next week. If we see continued liquidations in global financial markets, then Bitcoin is very likely to continue on its way down.
That means we could revisit the $4,000 area again, meaning Bitcoin will be locked in a range. A V-shaped recovery is less-likely (though not impossible) given the magnitude of the selloff. However, as long as the market will remain below the key $6,500 -$6,800 area, we believe sellers will continue to be in control and more downside lies ahead. Only a big break above the current week high could revive some optimism, and $7,600 will be the next resistance.
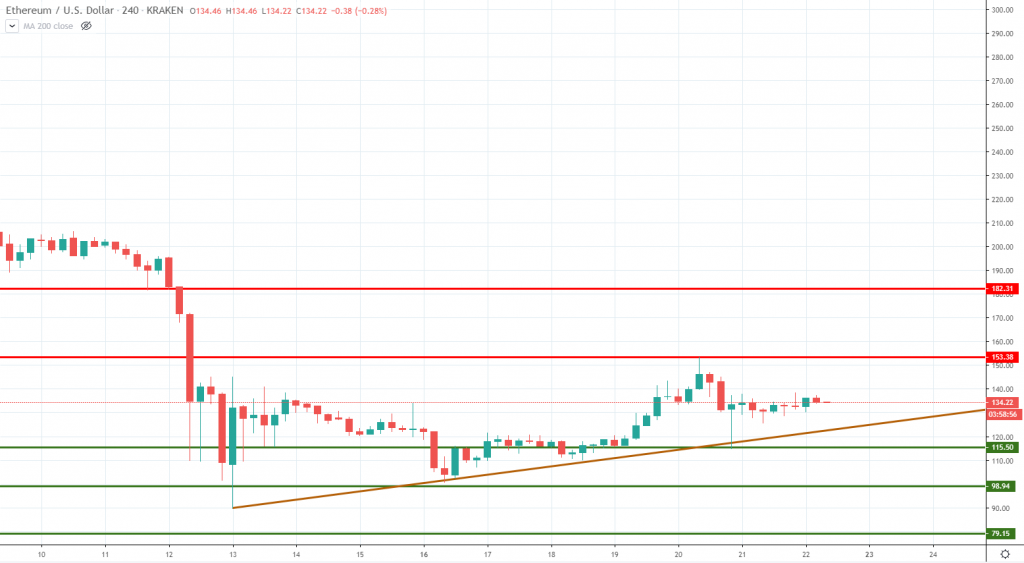
ETHUSD Kraken

In line with the Bitcoin performance, Ether had also managed to erase some of the losses but encountered resistance around the $150 area. On the positive side, we have a short-term bullish trend line already confirmed by three points and as long as the market won’t break below it, there are chances left for a deeper recovery on the way up.
Buyers wanting to enter the market should wait and see how the price will treat the trend line. If that holds, then we should revisit the current week’s high, located around $153. A break above that will open more room towards the $180 area.
On the flip side, breaking the trend line will expose $115, and even the $100 support area. An acceleration of the selloff could drive Ether back to the 2019 lows, located around $79. That would be a major blow for buyers since the bearishness will continue further. It’s too early to anticipate, but the best-case scenario is that sellers will attempt once again to drive the price towards the lows.
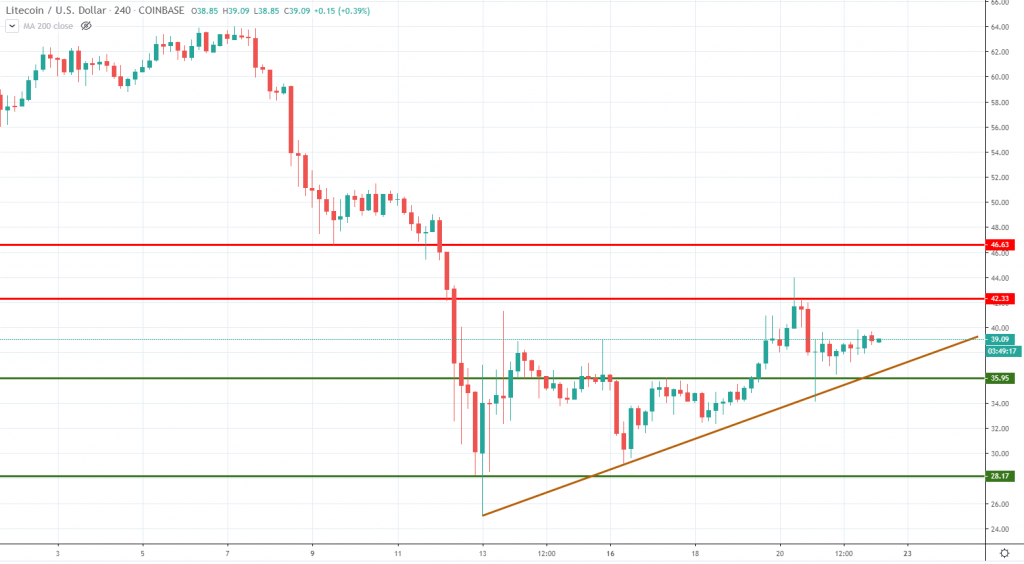
LTCUSD Coinbase

During uncertain periods like these, we should watch how Litecoin performs. The coin is considered to be a leading indicator, having the ability to show how the market could perform in the near term. So far, signs are encouraging, since LTC had been gradually building up in what could be considered a short-term parabolic structure.
Same as Ether, we can draw a trend line connecting three points, and the series of higher lows + higher highs raised the short-term prospects. The price encountered resistance around the $43 area and it will take a break to open more room towards $46. On the downside, a breakout below the trend line + the $35 level will mean LTC is doomed to revisit the $28 support or even the March 12th lows. If the market is truly bottoming, we should expect a bumpy ride ahead, until there will be a dominant order flow on either side.


There are no comments at the moment, do you want to add one?
Write a comment