
BTCUSD Coinbase
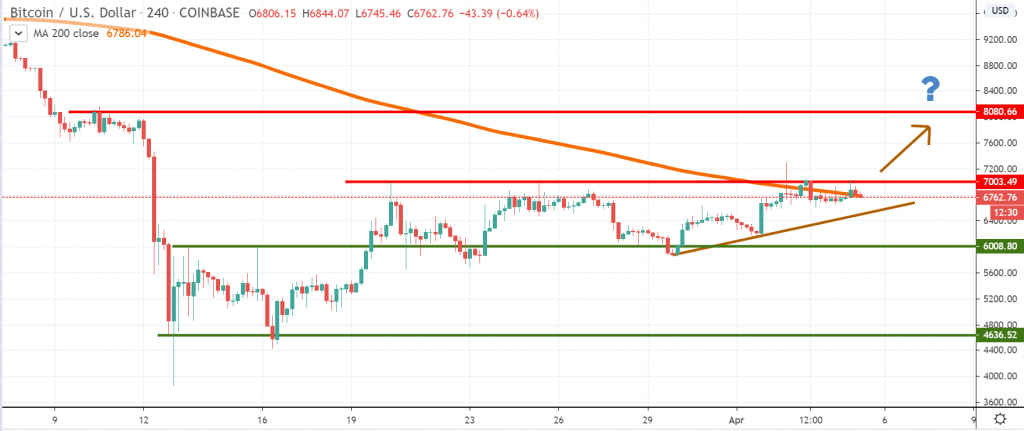
Selling activity had been very weak during the past week and Bitcoin buyers gradually squeezed the price towards the key $7,000 area. Even though the price did not break and close above it on the 4h chart, we see that the reaction from the sellers is not convincing enough to suggest that an impulsive move lower could start in the short-term.
As a result, we would like to switch to a bullish view over the upcoming week and anticipate a breakout higher that could take Bitcoin up to the $8,000 area. So far, the price action hovers around $6,700, which is where the 4h chart 200 moving average is also located.
The selling could resume, but it’s expected to be at a moderate pace. The short-term trend line drawn on our chart should act as support, as it already did two times. In the event of a breakout lower, our view on Bitcoin will change to bearish. $6,000 would be the first support, followed by $4,600 if selling intensifies. Based on the current price action picture, though, buyers are the ones favored and we should see a dramatic shift in sentiment to move in the other direction.
ETHUSD Kraken
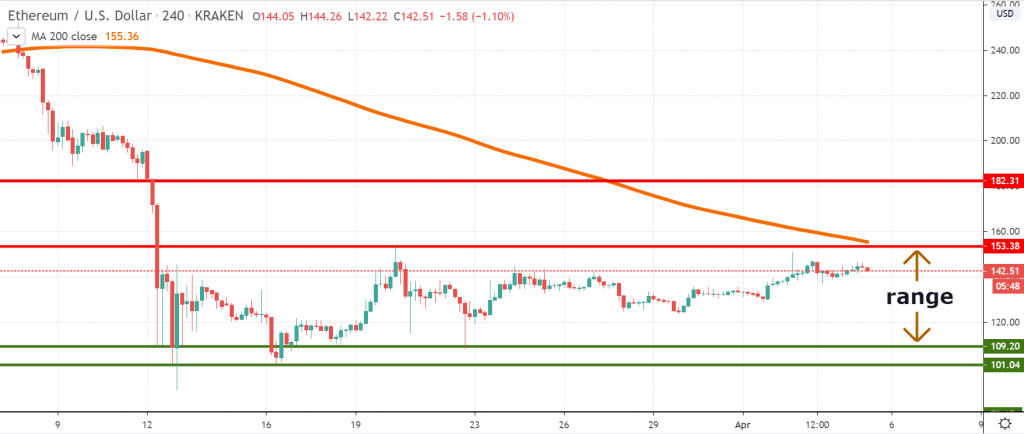
Ether volatility had dropped meaningfully over the past few days, suggesting a wide range of market participants are reluctant to make any moves. Although the price is above the March lows, the bottoming formation is not confirmed yet. We see the price oscillating in a range between $153 and $109 since March 16th and thus far, either side had been broken.
Until that happens, traders should play the range. On the upside, we must mention the upper line of the range is in confluence with the 4h chart 200 moving and that should add some extra selling orders on the board. If the upper resistance area breaks, then Ether will be poised to continue towards $182, where the next resistance zone is located.
As long as the price stays in the range, a drop towards $109 is not off the table. Doubled by the psychological area around $100, it should form a strong support zone and cap any further selling. Pay attention to how the price will react if it touches the upper bound of the range since that will determine the next direction.
LTCUSD Coinbase
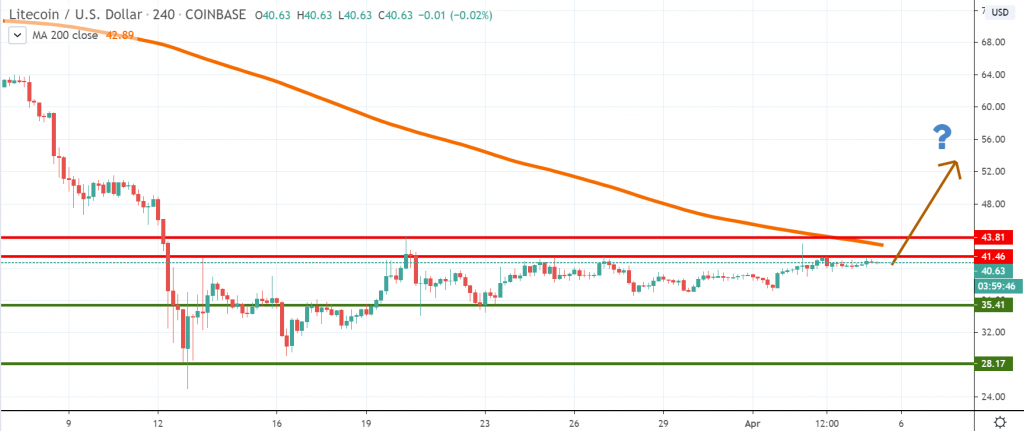
During times of price uncertainty, we should get back at LTC and see how it performs. Same as Bitcoin, the price seems to be pressured upwards towards a resistance located around $41.5 and $43.8. Combined with the 200 MA, it should form a strong barrier. However, if the buyers will manage to break above, that will be a major bullish sign and could signal gains will continue until the $50 area, at least.
If selling resumes around the key area, we should expect to see a retracement towards $35, where the price found support twice in the second half of March. Breaking below that will be a huge blow for the buyers since it will mean $28 will become the next target. So far the picture is bullish, but bear in mind uncertainties are still elevated across the global financial markets.


There are no comments at the moment, do you want to add one?
Write a comment