
BTCUSD Coinbase
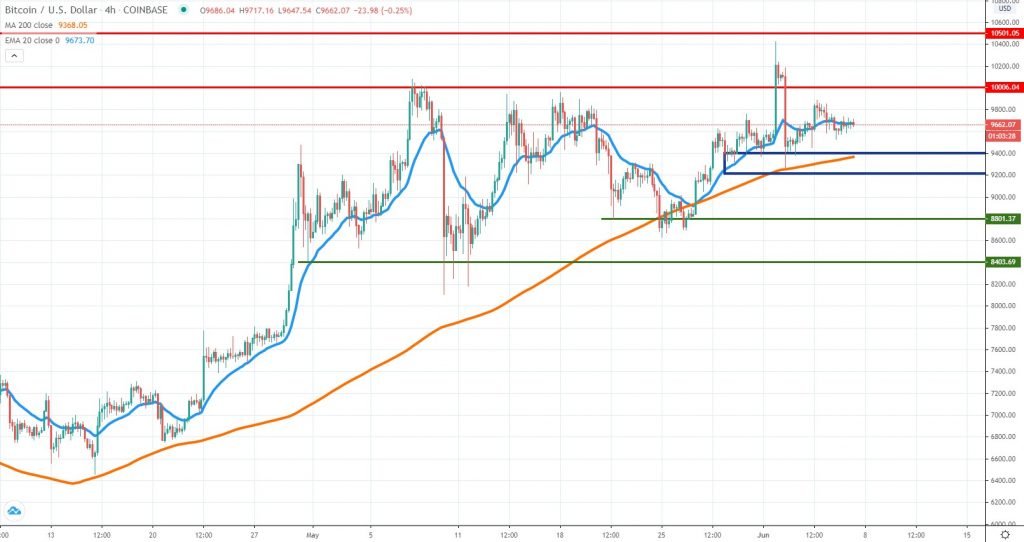
Bitcoin buyers showed some momentum at the beginning of the week and managed to break above the key $10,000 area. However, it wasn’t enough to spark a continuation higher, since the price action was unable to stay above the area. Since then, Bitcoin had been consolidating below $10,000, communicating there’s low volatility and neither market side has the upper hand.
At this point, traders should remain patient and see how the price will continue to behave. If a retest of the $10,000 level will occur, watch for selling interest. If buyers keep pushing higher, then it is very likely the upside will extend towards $10,500 or even $11,000.
If the price will break below the 4h chart 20 EMA, we should watch the area around the 200 SMA + the highlighted zone in our chart above. Breaking below that will be a short-term bearish signal and might push Bitcoin towards $8,800 or even $8,400. This looks like the less-likely scenario right now, but in case selling will become impulsive, our view will change.
ETHUSD Kraken
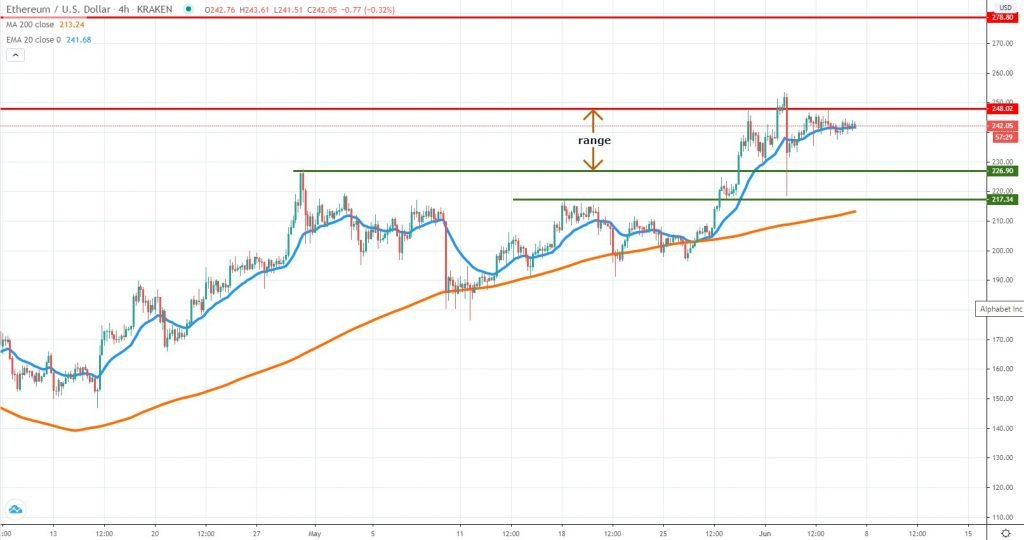
After breaking above the key $250 level, Ether had been influenced by the Bitcoin selloff and resumed the downside impulsively. As expected, the levels we’ve mentioned in our last weekly analysis, namely $226 and $217 acted as a support zone and prevented the leg down from extending further. Since then, most of the losses had been erased, communicating it might have been just an exhausted selloff.
If that will be the case, buyers should have no problem in breaking above last week’s high and extending the price further, towards $278, where the next key resistance level is located. At this point, ETH is floating above the 4h chart 20 EMA, which communicates there’s little influence from the sellers.
In case the price will break below the 20 EMA, $226 will follow as support and it will mean the price is trading in a well-defined range. The narrow daily ranges + low volatility suggests there a period of uncertainty going on and the next spike in volatility will very likely determine the future direction of price.
LTCUSD Coinbase
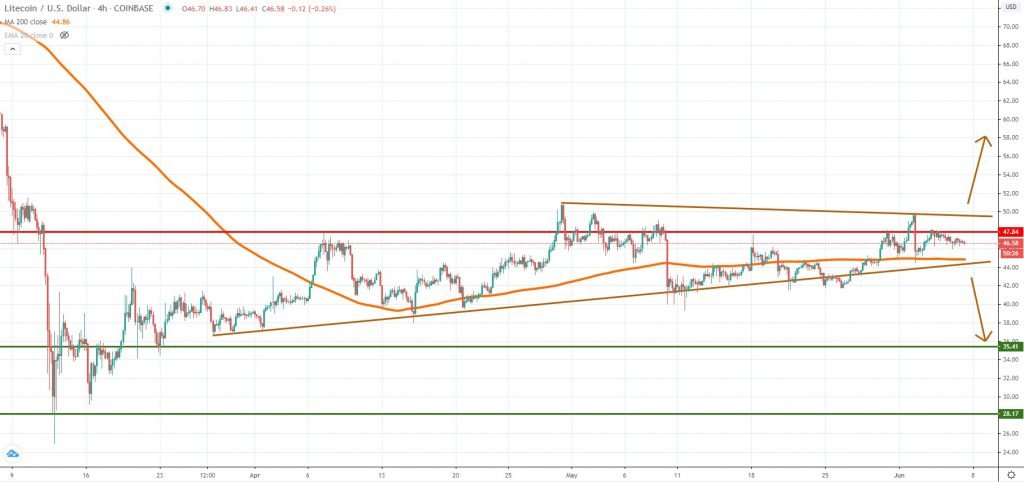
The broad compression period is very obvious if we take a look at how Litecoin had continued to perform. As you can see from our chart above, the price trades inside a triangle formation, and until a breakout will occur, the next dominant direction is under a question mark.
For now, the $47 key resistance area is managing to keep the upside limited, but the selloff is not impulsive. As a result, we suspect LTC will head towards the upper line of the triangle before encountering heavy resistance.
On the downside, support will be found around the 4h chart 200 moving average, which is where the lower triangle line is also located. The formation is almost filled and a breakout looks to be close. Conservative traders should wait until that will materialize to be sure where LTC and the broad market is headed to.


There are no comments at the moment, do you want to add one?
Write a comment