
BTCUSD (Coinbase)
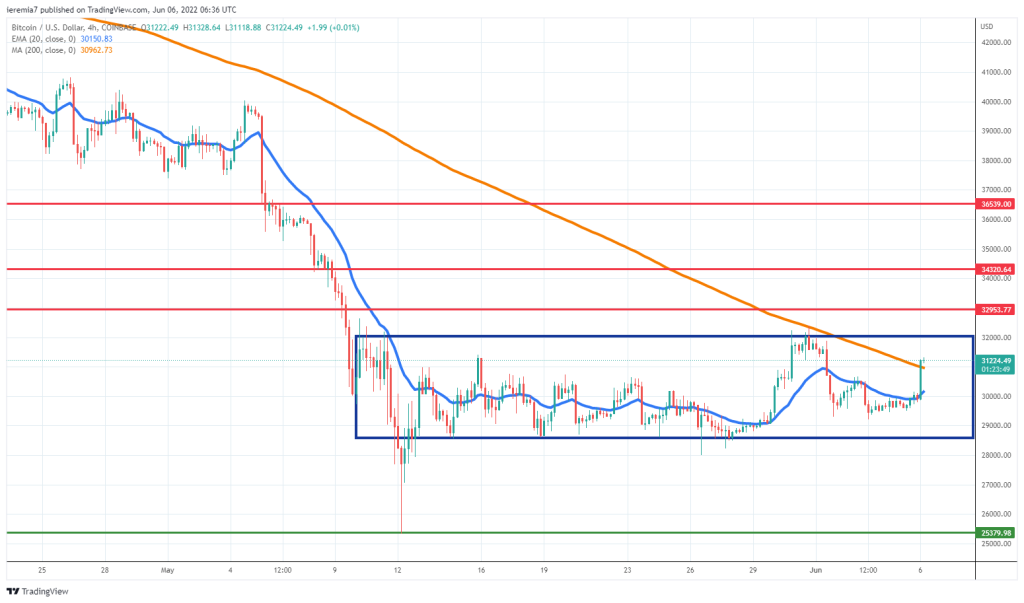
Since mid-May Bitcoin seems to have entered a period of stabilization, showing on the chart as a range between $32k and $28.5k. The structure continues to hold, but we can notice buyers are getting more active, threatening to break above the 4h chart 200 SMA.
In case that happens, then the pressure will mount on the upper side of the range. There is a slight improvement in risk sentiment but more is needed to get a bull run going. Above the range, watch how the price reacts to $33k, and $34k, two of the near-term resistance levels.
As long as Bitcoin stays inside the range, it is possible sellers would like to drive the price lower. This structure won’t hold indefinitely, so you should also watch for changes in the price action structure, that would suggest either side of the market is pushing for a breakout. Given the oversold conditions on higher time frames, we favor a break on the upside, a scenario that could materialize even this week.
ETHUSD (Kraken)
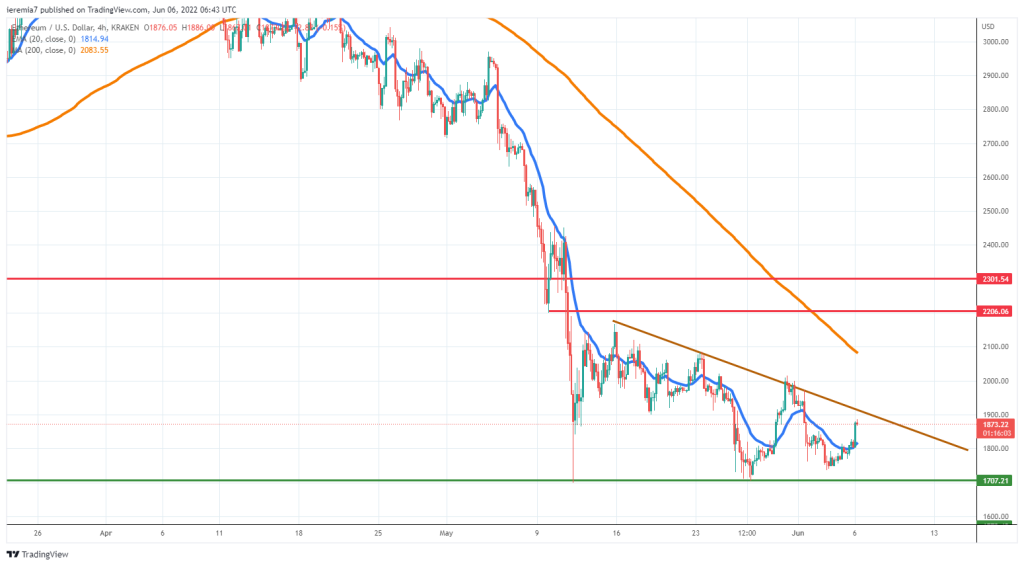
With Ether, things are a bit more bearish, since there is no balance in the price action as with Bitcoin. Instead, we can easily notice on the chart a downside triangle, a structure that generally precedes a continuation of the dominant trend.
From an order flow perspective, sellers are pressuring ETH by entering after small rallies and we can see how the May low has already been retested. However, Bitcoin can still drive the entire market with it, so if we see a break in BTC then the odds might turn in favor of bulls even with ETH.
You should be watching on what side the triangle will be breached for further clues on where this market is headed. Breaking the falling trend line would be a bullish sign and in that case, expect a continuation at least towards the 4h chart 200 SMA. The key resistance areas to watch are $2.2k and $2.3k. We think buyers will have a hard task overcoming that zone.
Also, watch if there is a change of price relationship with the 4h chart 20 EMA. For an extended period, the market treated it as resistance and now that seems to be shifting. We did not get a third a second retest of the May low, which means buyers have been confident to buy higher.
XRPUSD (Kraken)
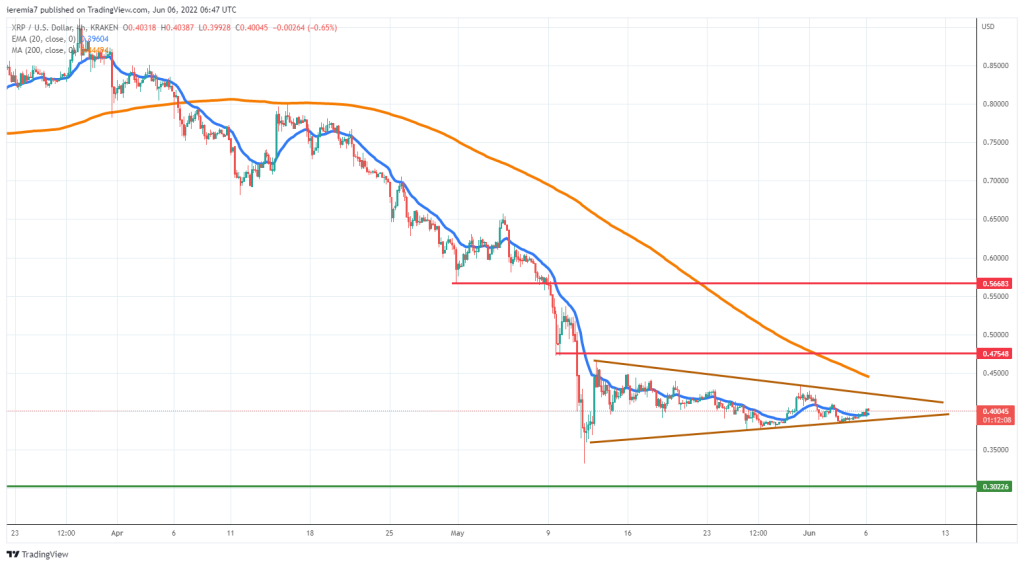
XRP is another token that had to endure severe losses over the past couple of months, but since mid-May, XRP volatility has been compressing inside a symmetrical triangle formation. When the breakout takes place, you should expect to see an impulsive move in that direction.
For now, that did not occur, so traders can still play short-term moves. If the market breaks on the upside, we expect XRP to move towards 47 cents or even 56 cents, two of the resistance levels easily noticeable on the chart.
On the other hand, a breakout and continuation below the triangle means bad news for buyers and XRP could weaken towards 30 cents. This could become a tricky setup to trade, given it’s possible the price breaks lower and then starts to move up impulsively.


There are no comments at the moment, do you want to add one?
Write a comment