Bitcoin
Source: dailyfx.com
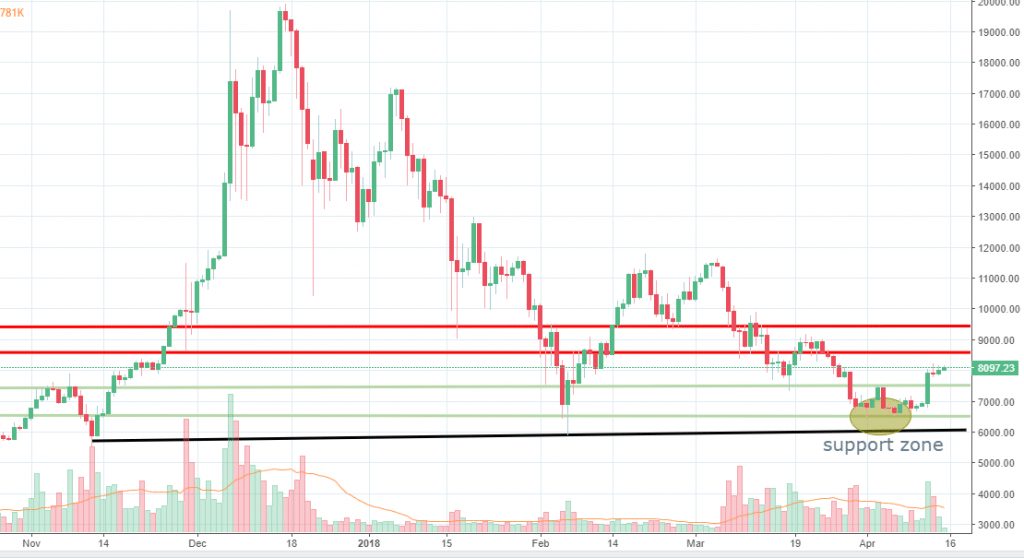
The Bitcoin price had rallied this week, surging from the 6,500 to 8,100 at the time of writing. Even though Bank of America talked about the Bitcoin bubble recently, the price had managed to recover and the prospects for some further gains are encouraging.
The price started to rise, before touching our ascending trend line, which communicates the bulls were eager to buy the digital coin at a higher price.
We expect cryptocurrencies to recover in the second half of 2018, and that is why we believe Bitcoin will continue upwards, towards the 9,000 resistance area. Buyers might face some tough resistance around the 9,000-9,500 and sellers might rejoin heavily there.
On the downside, we expect the support area marked on the chart to hold, if the downside resumes. The trend line follows little below it and buyers are expected to rejoin impulsively there.
Monero
Source: dailyfx.com
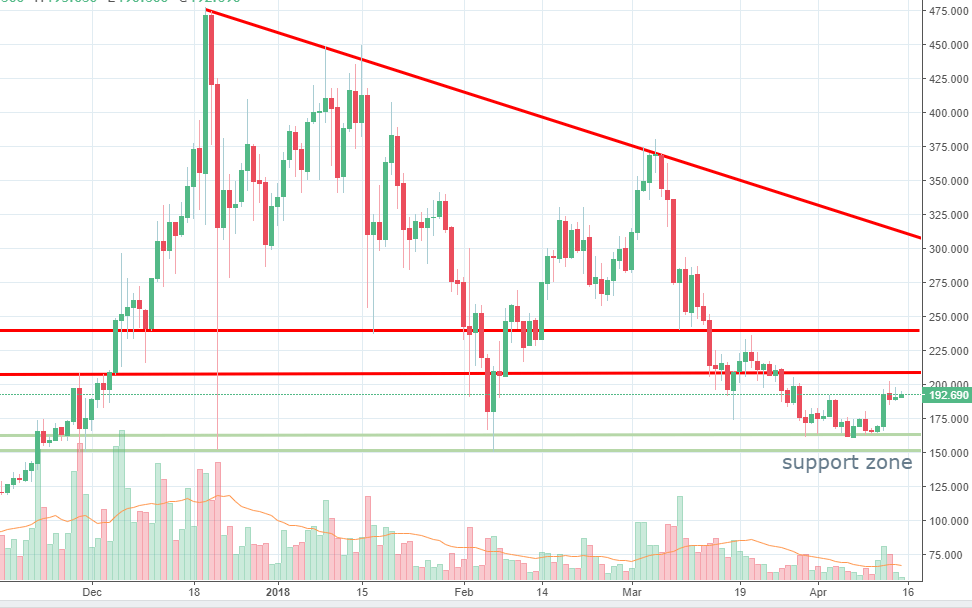
We’ve actively talked about Monero for a few weeks in a row, as the price had moved impulsively on the downside and massive profit potential had been on the table. The price had dropped from 373 towards 160 support, meaning more than 50% decrease in value. However, for the past week, buyers had been showing signs of activity and the drop stalled around the 163 support level.
Even if the sellers resume impulsively we expect the 163-152 support zone to hold as it is a critical support zone. A break below it will be a huge blow for buyers and the sellers could continue to drive the price lower.
However, our assumption is that the price will manage to recover further following the drop, the first resistance level is located around the 209 level. Above it, 238 follows and we could see sellers become pretty active there.
Ripple

Source: dailyfx.com
Ripple moved in line with the other major cryptocurrencies and managed to recover more than 30% in the past week. However, as the price moved on the upside, it reached again the broken support located around the 0.64 level. We’ve talked about that level many times in the past and the break below it was a clear sign of weakness.
At the present time, we see hesitation around the level, also due to the fact that a short-term descending trend line is located there. This confluence of indicators could generate new selling pressure in the days ahead, so buying at this point won’t be advised.
A break above the support + trend line will clearly give the bulls more confidence and 0.88 is the next significant support.
If the price will slide lower again, support could emerge around the 0.45 level, where the current leg up had started a few days ago.


There are no comments at the moment, do you want to add one?
Write a comment