
BTCUSD (Coinbase)
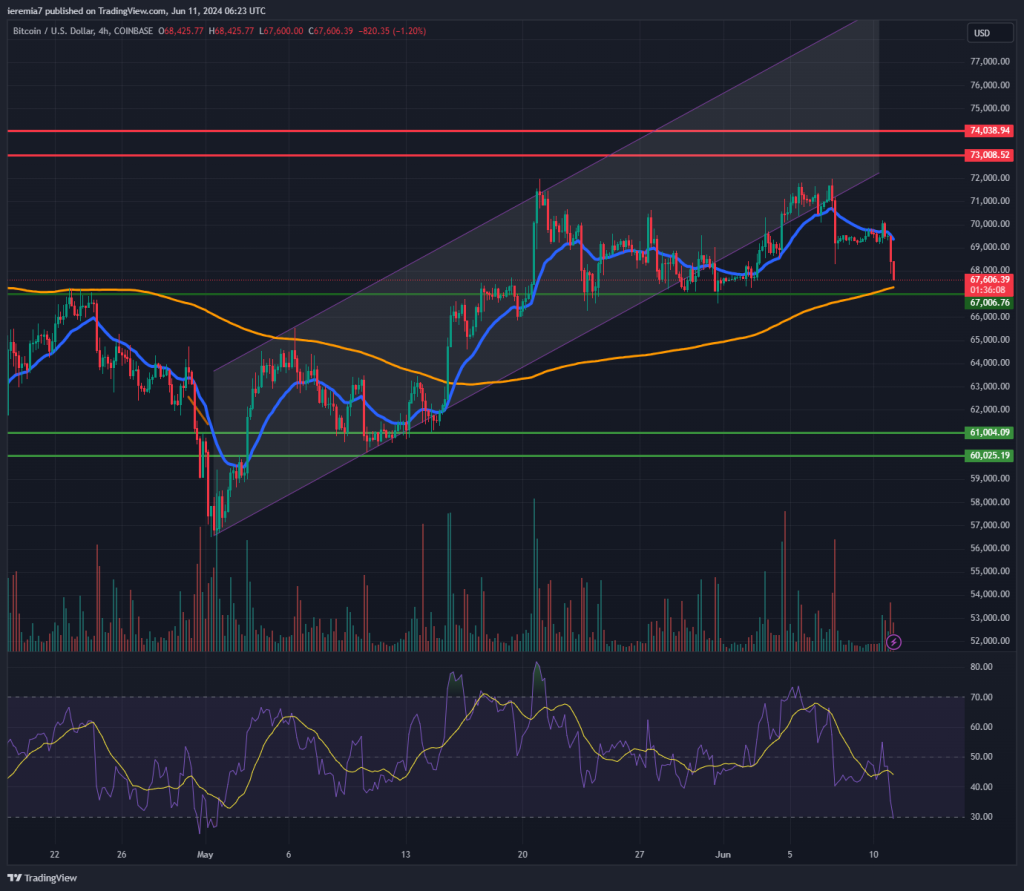
Bitcoin is under pressure at the time of writing and as you can see, the price broke below the ascending channel we talked about last week. That’s a bearish sign and could point out to further losses during the week.
However, the main event is the FOMC scheduled for Wednesday and that should dictate the risk sentiment. Volatility is expected to pick, but if there won’t be any major surprises from the FED, the path of least resistance will be up.
In the short term, the closest cluster of support comes at $67,000, where the 200 SMA also overlaps. Breaking below that could signal further downside potential toward $61,000. We aren’t yet confident enough to suggest an impulsive dip will occur, given the market needs a catalyst.
On the upside, we continue to view the $73k – $74k as a major resistance. That’s also located around the ATH, so a breakout higher could spur further buying interest. In that scenario, Bitcoin could aim for $80k, the next psychological level on the chart. We would like to advise caution once again, in case the price reaches uncharted terrain.
ETHUSD (Kraken)
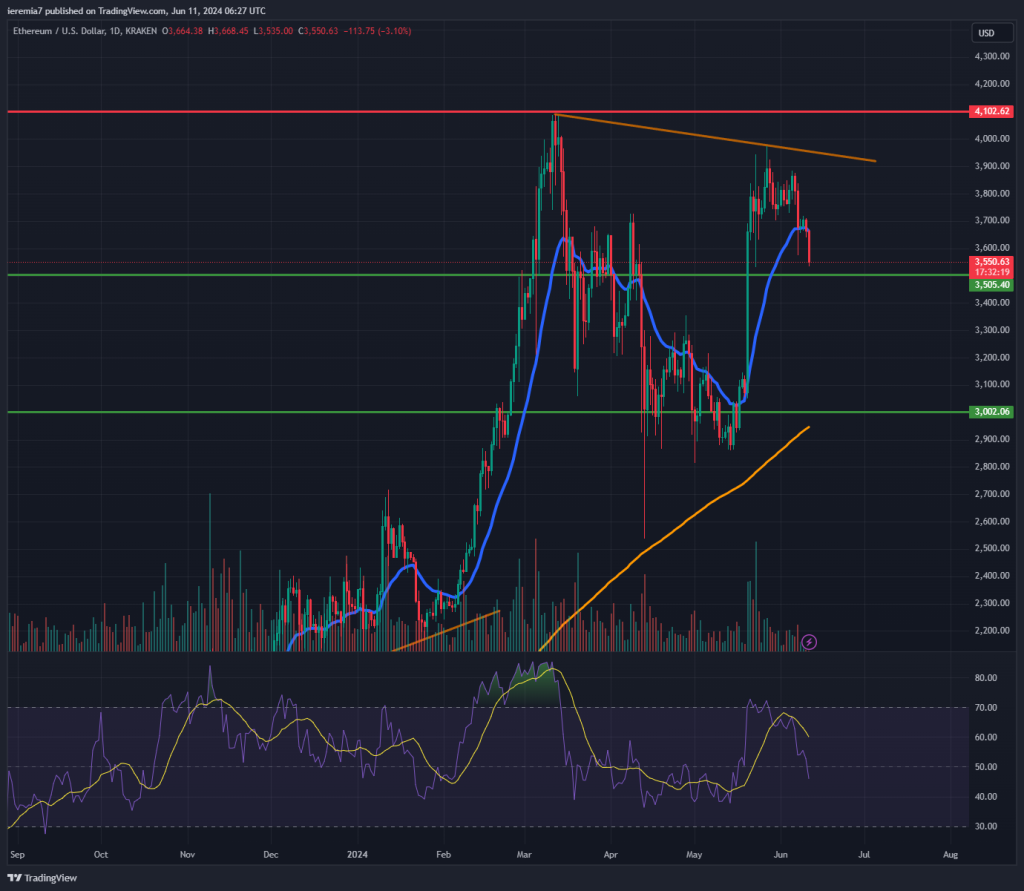
Ether paused before reaching the March highs and that raises the question of whether we’ve seen a lower high, which is generally a bearish sign. Hard to tell at this point, considering the market has been very sensitive to news around a US-listed ETF based on Ethereum.
The fact that the price failed to build further momentum is a short-term sign of weakness, but bear in mind that the sentiment depends on any potential news related to the launch of an ETF. Shifting to our regular technical analysis, $3,500 is the closest support and in case of a break lower, $3,300 and $3,000 might be in play.
In case the market rebounds, $3,900 is the first significant resistance, followed by $4,100, where the March highs are also located. Breaking to a new 2024 high will be a major bullish development for ETH.
LINKUSD (Binance)
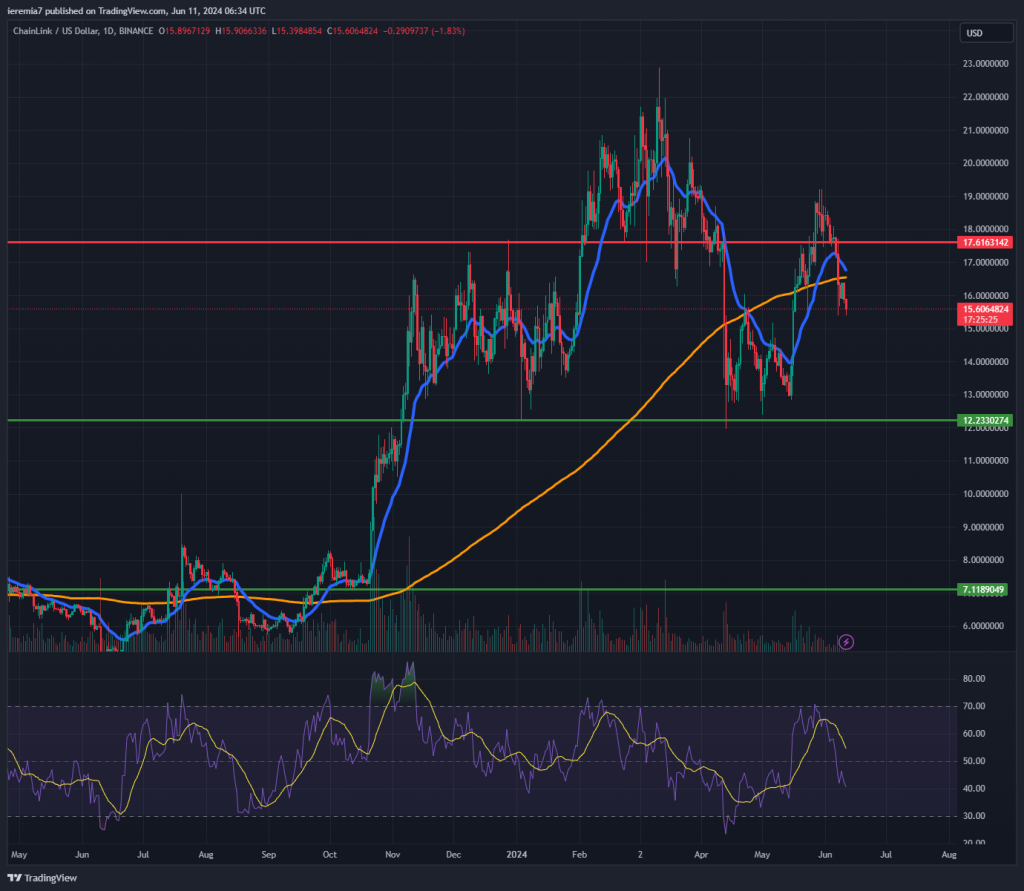
A third coin we want to talk about this week is Chainlink and we do that because of a potential H&S pattern showing on the chart. The neckline is at $12.2 and the shoulder line is at $17.6, which has acted as heavy resistance recently.
If the pattern turns out to be true, that’s very bad news for LINK, since it could signal more losses in the upcoming weeks and months. That’s not yet a certainty, but should be considered by all traders overconfident nothing can bring this market down.
We want to take things step by step and the first thing to watch is whether LINK continues to weaken towards the neckline ($12.3 level on the chart). We can see that the price already broke below the daily 200 SMA, which is a bearish sign in the short term.
The H&S pattern will be negated if the price breaks above $17.6 and makes a new high above $19. In that scenario, the next likely target will be $23.


There are no comments at the moment, do you want to add one?
Write a comment