
Bitcoin
Source: dailyfx.com
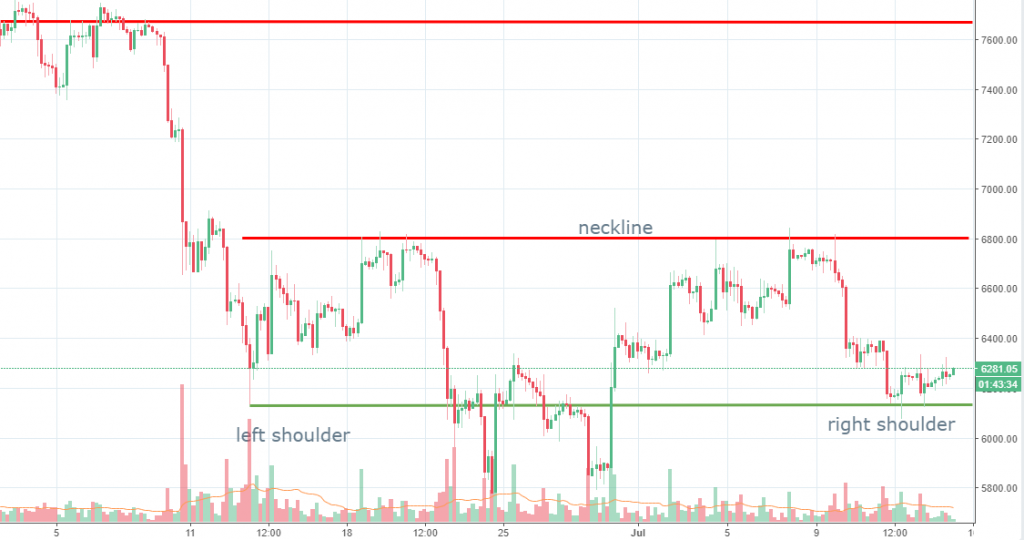
As we have anticipated in our last weekly crypto analysis, the Bitcoin price had found resistance around the 6,800 figure and then slumped towards 6,130 level. We have also suspected a potential inverted head and shoulders pattern and given the latest price development, the scenario seems more plausible right now.
Support had emerged around the top of the left shoulder and at the present time, we see smaller and smaller red candles, suggesting that the sellers are being squeezed by the bulls.
If the conditions won’t change, we expect the price of Bitcoin to continue higher towards the neckline, located at 6,800. A breakout above the neckline could unlock an additional 1,000 in profits, with the next resistance located around 7,700.
Only a strong breakout below the 6,130 level could negate the head and shoulders pattern and thus far that looks pretty unlikely to happen.
Ethereum
Source: dailyfx.com
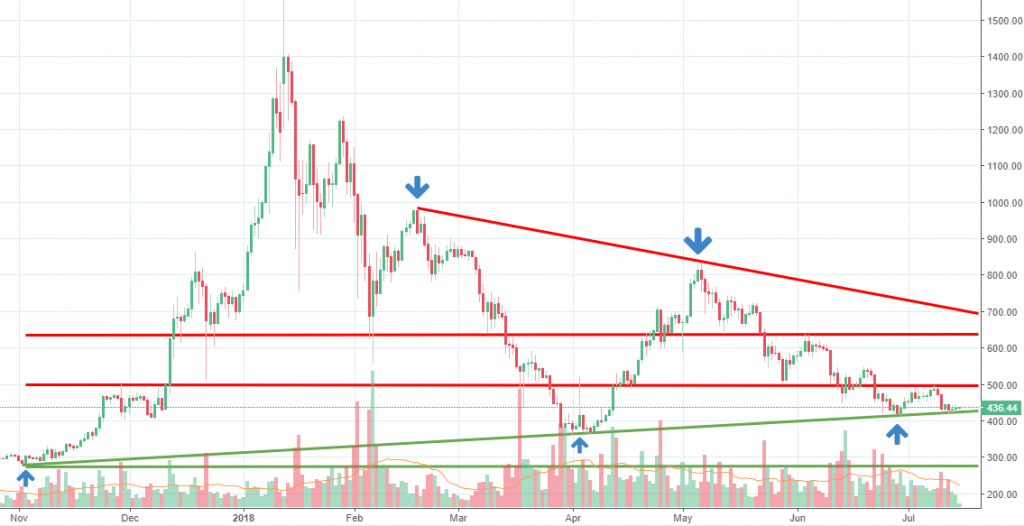
For the past week, the Ethereum price had been under pressure overall, but since the middle of the week, we see consolidation taking place. That happens because the price had reached the bottom line of a triangle formation, a structure that started to form back in November 2017.
We see two strong rejections off that line, marked by two arrows. That is why we suspect the price could begin to climb higher towards 493 or even 640 in the longer run. The upper line of the triangle will follow then together with strong sellers parked around it.
We believe the price action will continue to fluctuate inside the triangle formation. However, a downside breakout and close below on a daily basis + weak response from the bulls afterward will signal further weakness and the price could potentially head towards 270 support.
Still, no sign of that happening right now and that is why we maintain our bullish view for the short run.
EOS
Source: dailyfx.com
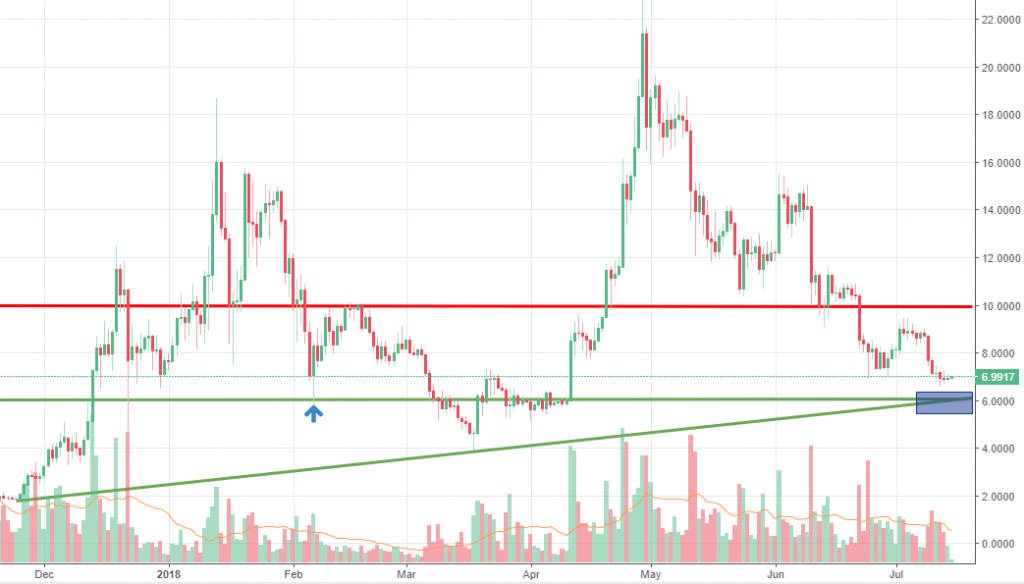
The EOS price had been under heavy pressure for the past week, sliding almost 20%. After conducting the largest ICO ever, with more than $4 billion raised, Eos disappointed its users, as the blockchain failed one day after launching. The problems had been solved, but there are raising doubts the company will manage to implement all the features mentioned in the white paper.
Getting back to the technical analysis, we suspect the slide could extend a little, but we have spotted an interesting support zone, located around the 6.0 figure. A support level (6.02) and an ascending trend line meet there which could result in a stronger accumulation of buyers.
We expect the area to absorb all the selling pressure and a new leg up to start around it. A breakout below it, however, will open more room towards the 4.0 support area.
Briefings about ICOs
According to icowatchlist.com, Lexit is a project that is currently raising funds and will end in 10 days. Lexit is the first online marketplace that allows entrepreneurs to trade IP, copyrights, code, and even sell their entire startups.
In terms of upcoming ICOs, EO.TRADE will start on July 16th. It is a leading Online Broker ExpertOption introducing the EO ecosystem: EO.Trade crypto exchange, EO.Finance wallet and EO.News portal.


There are no comments at the moment, do you want to add one?
Write a comment