
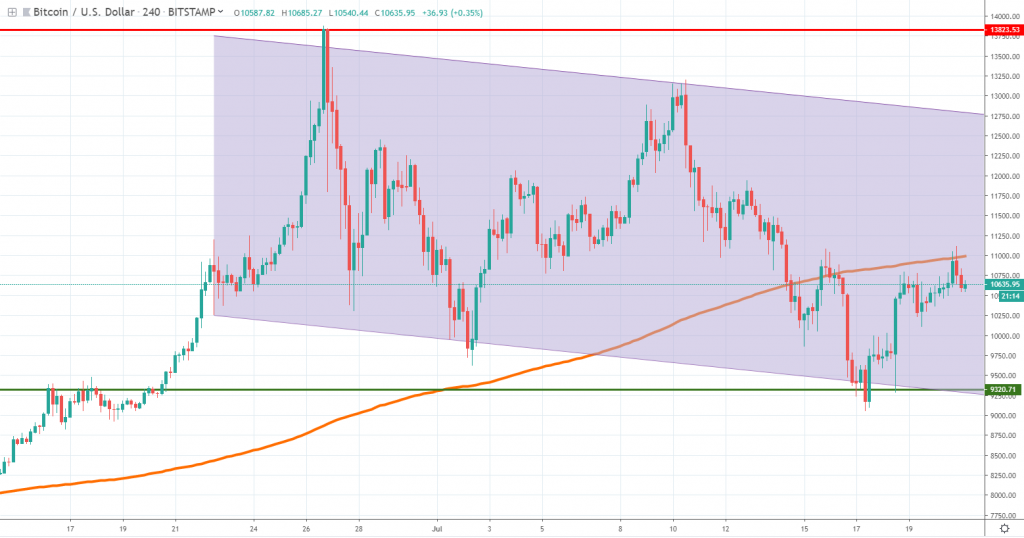
BTCUSD Coinbase
Source: tradingview.com
As we have expected in our last weekly analysis, Bitcoin continued to weaken and reached a new July low at around $9,049. Looking at a bigger picture, we are in a downward flag, which is still a corrective price action formation. Although selling had intensified for the past few weeks, the price remains in a consolidation phase as long as it won’t breach below the structure.
Buyers had resumed for the past three days, but the price still trades below the 4h chart 200 moving average, which acted as resistance two times. If bulls will push the price above it again, we could see Bitcoin edging higher towards $12,500, where it will intersect with the upper line of the consolidation structure.
Renewed pressure on the downside could mean sellers will retest the $9,320 area, while further weakness below it could mean Bitcoin is poised to edge towards $8,000.
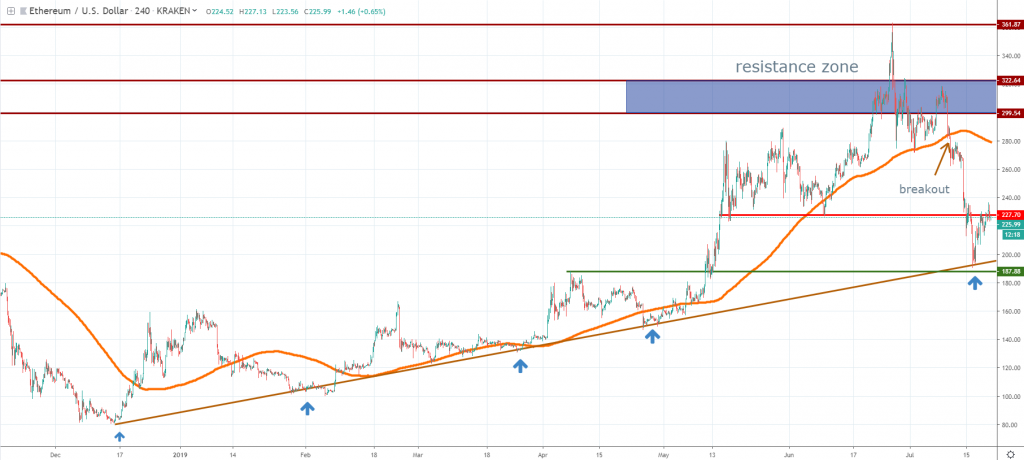
ETHUSD Kraken
Source: tradingview.com
Since the false breakout setup that occurred at the end of June, Ether weakened substantially towards the $200 area, where it found support a few days ago. Interestingly, though, the price action reacted around an ascending trend line that goes back to mid-December 2018.
Since the market participants respected the line five times until now, we could see strong support around it in case sellers will resume in the near term. A breakout below it will be the most negative scenario, as it could open further weakness towards the 2018 lows.
On the other hand, as long as we remain above the trend line, we could see buyers continuing to accumulate and potentially drive the price higher, towards $260 -$280, where resistance could be encountered. Still, we are below the 4h chart 200 moving average and that slightly favors the sellers at the present time.
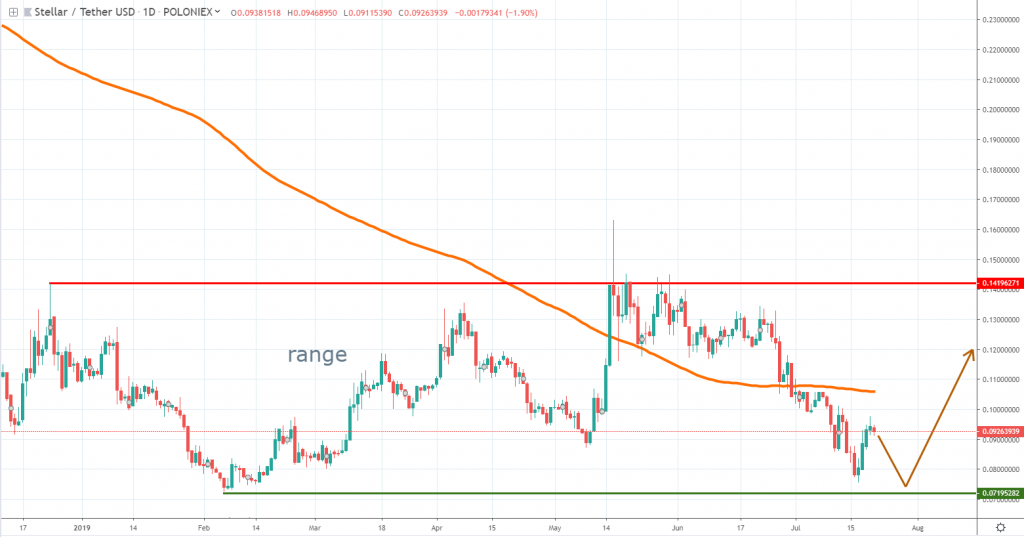
STRUSDT Poloniex
Source: tradingview.com
Since the beginning of 2019, Stellar had been locked in a range between 14.2 cents and 7.1 cents, being one of the large-cap underperformers of the year. At the present time, the price seems headed towards the February 2019 low, located around 7.19 cents, which is where the bottom of our range is also located.
The order flow is still biased towards the sell-side, even though we saw consistent buying for the past four days. We are below the daily 200 moving average and that confirms sellers are still the ones in control.
However, we think strong buyers will emerge around the bottom of the range and a new significant bullish move could start to unfold. Spikes below the 2019 low could be seen, given the lower liquidity of the market, but we expect the area to hold and losses below it to be contained.
Briefings about ICOs
On July 28th, iProtocol Network will end its ICO and up until now, it managed to raise more than $1 million. The project wants to build a decentralized layer database system with a ready-to-use social platform, with the integration of Artificial Intelligence.
Asure Network will start its ICO on August 1st in an attempt to build the first scalable decentralized social security network as a layer 2 scaling network that enables fast, easy, and secure transactions.


There are no comments at the moment, do you want to add one?
Write a comment