
BTCUSD (Coinbase)
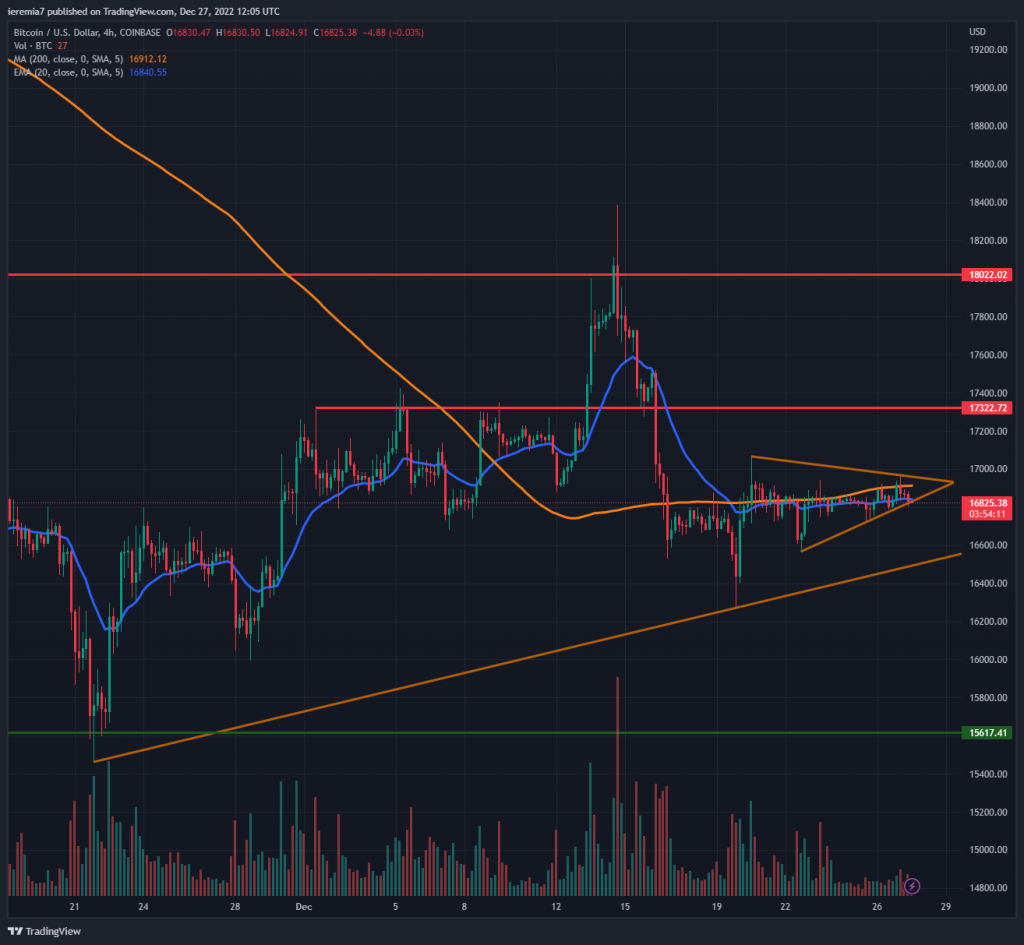
Not a lot of movement can be seen in the price of Bitcoin last week, consistent with what we expected in our prior analysis. However, BTC is now locked in a triangle formation, and once breached, there could be a pick-up in activity.
The price is trading below the 4h chart 200 SMA and has been treating that dynamic level as resistance for an entire week. Breaking above it should be a sign of relief and in that scenario, we suspect a move up towards $17,300 or even $18,000 would be on the cards. Positive seasonality combined with lighter volumes can lead to a temporary rise of BTC, but keep in mind we’re holding our short-term negative outlook in place. More activity should be seen after January 2nd, 2023.
We should not neglect the bearish scenario if the triangle breaks on the downside. That would signal weakness and a potential retest of an ascending trend line going back to November 21st. Until volatility picks up again, Bitcoin should be trading between $15,600 and $18,000, if no major news comes out.
ETHUSD (Kraken)
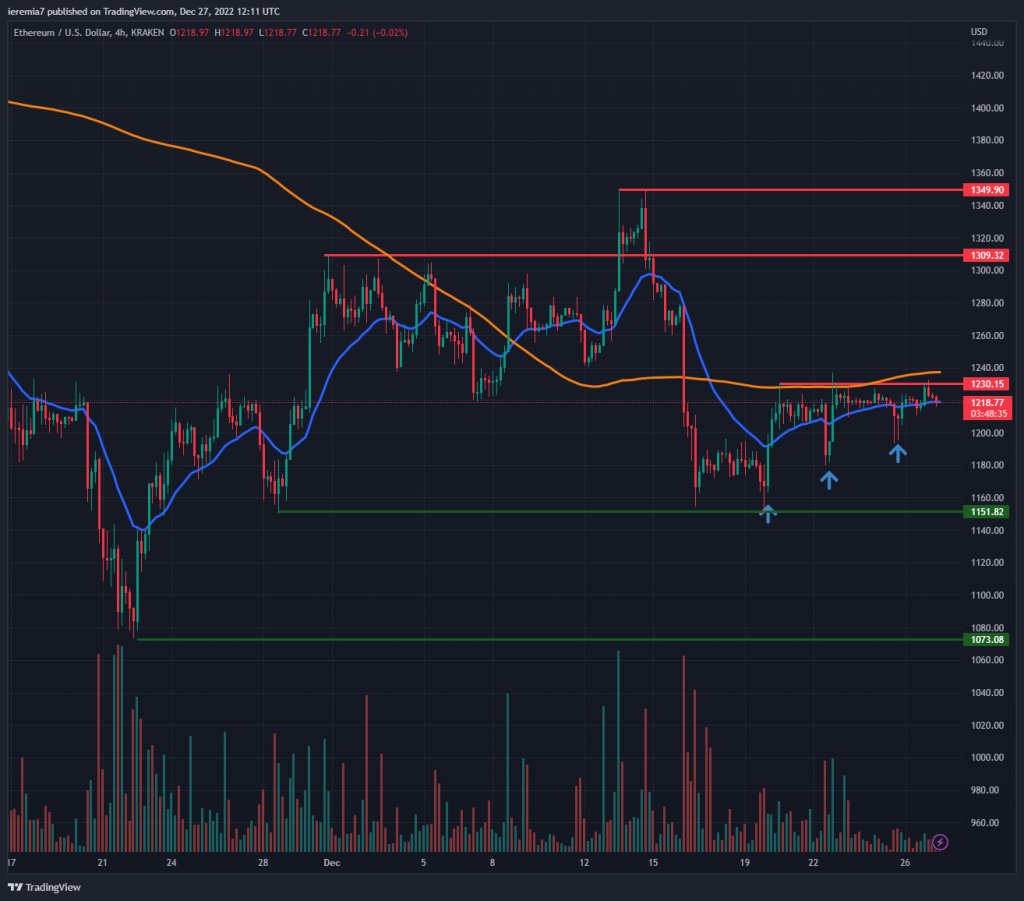
A similar muted activity can be spotted in Ether, doubled by very low trading volumes. Even if buyers have been entering the market at higher and higher levels, $1,230 turned out to be a decent resistance thus far.
If buyers eventually manage to drive the price above it, our sentiment shifts in favor of a bullish move up toward $1,300 or $1,350. Traders should keep an eye on the 4h chart 200 SMA, as well, because that could also turn out to be a major resistance area to energize new sellers.
Breaking below $1,200 would be a bearish signal and might drive ETH toward $1,150 where bids emerged a few days earlier. There should be low volatility and nothing major occurring this week, but given the thin liquidity, the support/resistance levels we’ve mentioned could lead to some decent short-term price moves.
XCNUSD (Bitfinex)
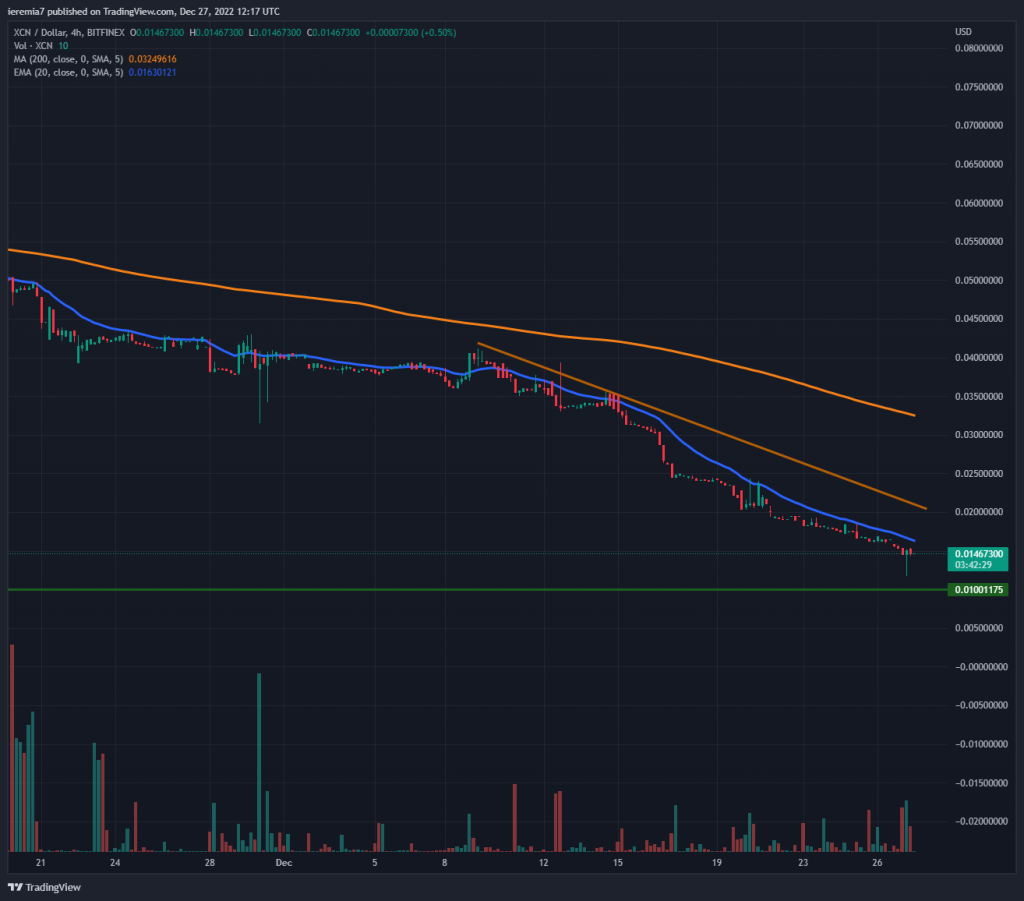
Traders looking for more volatility during the holiday season should monitor smaller altcoins. One great example is Chain (XCN) a token that managed to lose 30% of its value during the last week. As the chart shows, there is impulsive selling going on, pressuring the coin towards the psychological area of around 1 cent.
Since September, this has been a heavily hit name and it would be a mistake to try catching a falling knife right now. However, bounces off key levels can happen, which is why we are emphasizing the 1 cent area.
On the upside, the 4h chart 20 EMA acted as a place where sellers resumed impulsively. Bulls should wait until the relationship with the EMA changes and the market starts treating it as support, instead of resistance. Trading volumes have spiked, on the sell side, suggesting the order flow remains titled in favor of bears. Dipping below 1 cent would be another warning sign and in an illiquid environment, the price can drop towards 0.5 cents before finding support.


There are no comments at the moment, do you want to add one?
Write a comment