
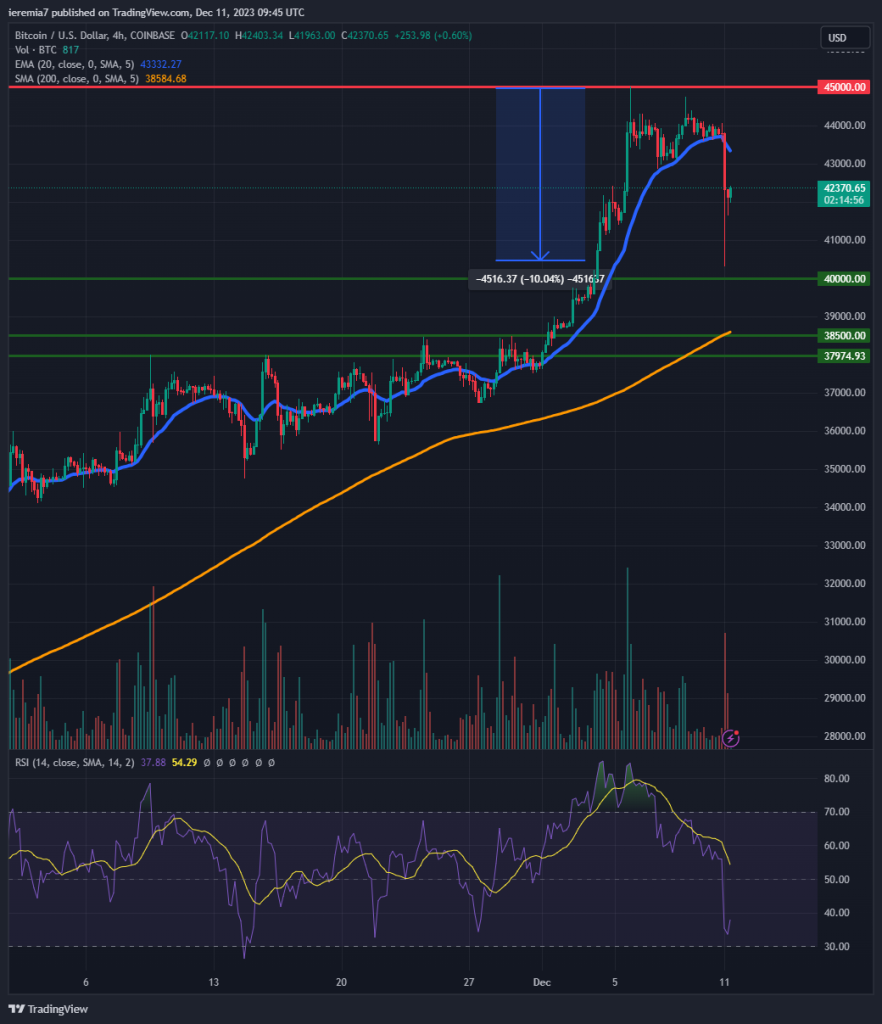
BTCUSD (Coinbase)
Source: TradingView
This week seems to be starting with a backdrop since Bitcoin is down 3% today. Moreover, as our chart shows, we can see that the price stumbled into resistance at $45,000 and then retraced 10%.
Buyers saw the dip as an opportunity to increase their long exposure, hence the swift jump off the lows. However, a 10% correction is something to note, as we haven’t seen heavy selling in a while. This could indicate that market participants believe conditions are overbought, favoring a deeper pullback.
Although we are not yet past Christmas and seasonality is still a tailwind for risk assets, we advise caution. This week we have central bank meetings (FED, ECB, BoE and others), which means markets will follow the projected path for interest rates.
Hawkish expectations would be a bearish sign, considering financial markets are already pricing in multiple rate cuts for 2024. We view Bitcoin as stuck in a range between $45,000 and $40,000. Breaking the downside will open more room towards $38,500 and $38,000. Conversely, an upside break will mean we could see BTC inching closer to $50,000 before the year wraps up.
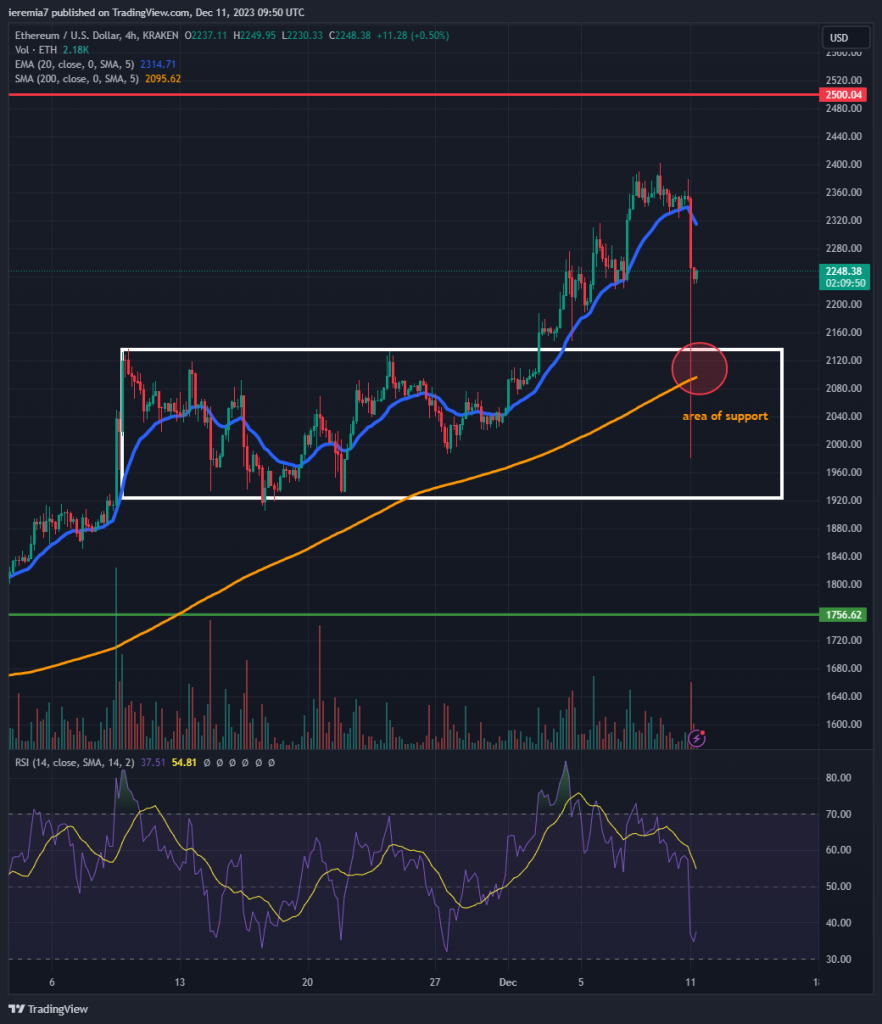
ETHUSD (Kraken)
Source: TradingView
Ether witnessed heavier selling, given the price slumped 17% from the highs reached on December 9th. Still, same as with Bitcoin, the dip has been bought. We can see how the price action reacted to the top of a range we talked about several weeks ago, and the 4h chart 200 SMA. Also, the $2,000 psychological area is where buyers drew a line in the sand.
The correction drove the RSI well below overbought conditions, so if there is no surprise related to US inflation or extremely hawkish central banks, Ether should be able to erase all gains. In that scenario, we favor a continuation towards $2,500, where selling can emerge strongly again.
If renewed selling kicks back in, the market has to hold above the 200 SMA and $2,000. Failure to do that will unlock more downside potential towards $1,750 in the weeks ahead. At present, we don’t believe the bullish move has ended.
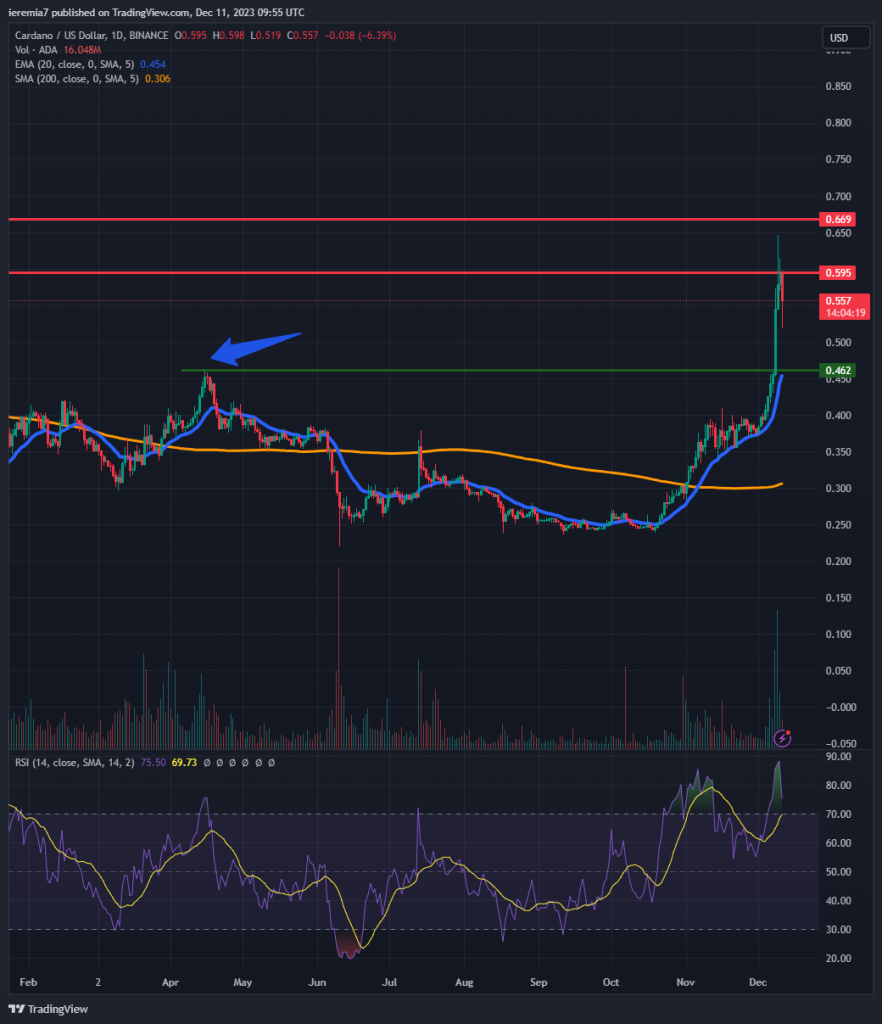
ADAUSD (Binance)
Source: TradingView
Although most coins are witnessing losses, some manage to outperform the broader market. This is the case with Cardano, which is up more than 30% in 7 days. Once the market broke above 46 cents, a key resistance area (now turned into support), that was the green light to pump the price up.
However, we believe 59 cents and 67 cents are resistance levels as well, so profit-taking is expected around those areas. The price pierced above 60 cents but encountered selling, at a time when the daily RSI was also extremely overbought.
The textbook bullish setup would happen if the price retraced back to 49 cents and finds support there. That would put the market in a better technical position for the next move up. We favor the upside as long as the price is trading above that level. We are also well above the daily 200 SMA, which suggests a bullish environment.


There are no comments at the moment, do you want to add one?
Write a comment