
BTCUSD (Coinbase)
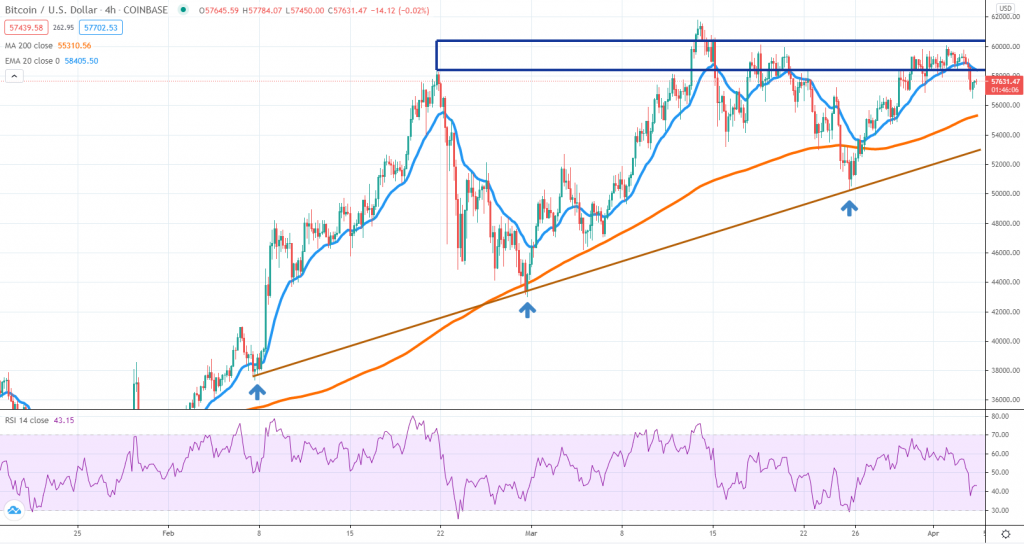
The longer-term Bitcoin picture had not been deteriorated, even though the price is struggling to break above $60,000 since mid-March. We can easily notice a key resistance area around $58k – $60k, but at the same time, a series of higher highs, the last two emerging around or little below the 4h chart 200 SMA.
If the pressure will be mounting on the resistance area, this will increasingly turn out to be a pre-breakout structure, signaling more upside momentum in the next few weeks. We’re looking at the 4h chart so the breakout could not take place during the following week, but as long as the price stays above $50k, our bias remains on the bullish side.
We should not exclude a turn lower, but the line in the sand is $50k. That’s the March 25th low and a breakout below it will generate a lower low and a shift in the price action structure. Now it’s the Easter Holiday across the Western World and the activity in BTC had been rather muted this weekend.
ETHUSD (Kraken)
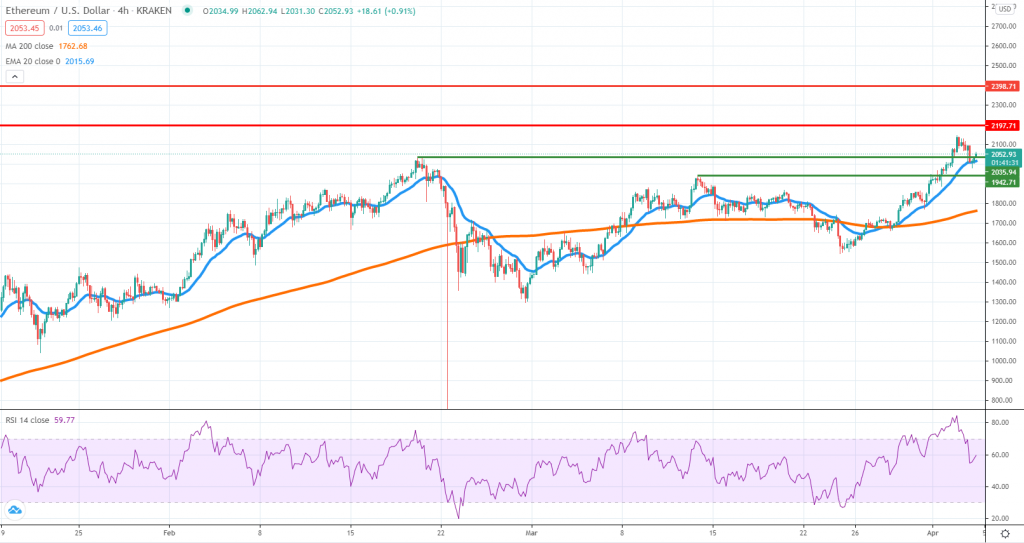
Ether looks to be in a much better shape after breaking above the February all-time high several days ago. Given extreme oversold conditions, the price retraced lower after the break but now we see it rotating higher again around the role-reversal level (previous all-time high).
The market treating a prior resistance as support is a major indication for a continuation higher, so as long as the momentum will be sustained, ETH can extend further. Due to uncharted terrain, traders will need to focus on psychological levels. $2,200 or $2,400 are the most significant, followed by $2,500.
Traders should expect to see muted activity on Monday also, while from Tuesday things should get back to normal. An impulsive break below the $2,000 area will be a short-term warning for buyers, as we could see a pullback towards $1,800 before another push higher.
BNBUSD (Binance)
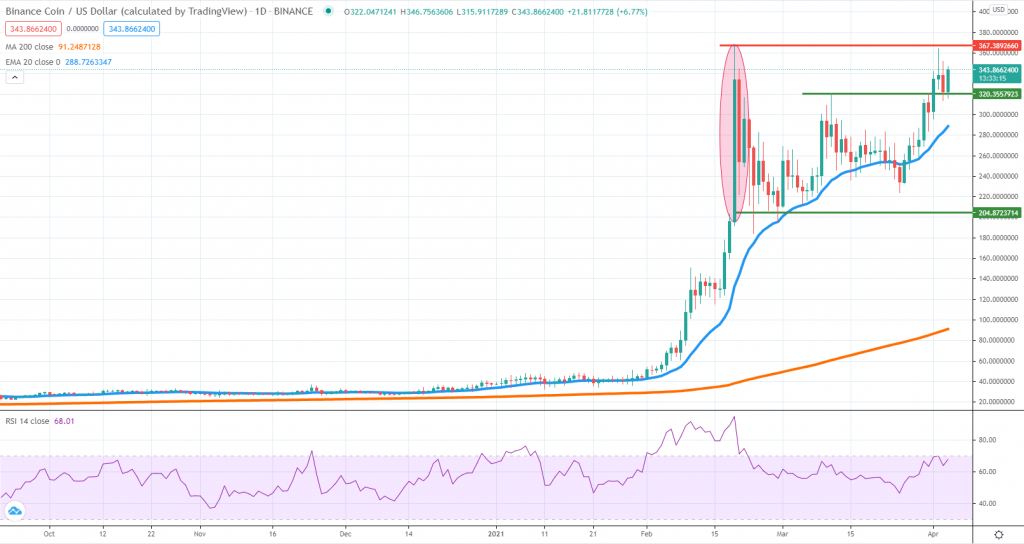
Binance Coin had a stunning performance so far this year, but looking at the daily chart, it could be in a bubble. The largest candle that formed at the end of the push higher followed by a strong counter-trend move is not favorable and might be suggesting an exhausted price action structure.
We now see buyers pushing the price towards the all-time high once again and if it breaks, there could be some follow-through buying. However, buyers wanting to get long should remain cautious, since it could be a trap before more selling unfolds.
Although BNB is among the best-performing tokens for the year, the impressive gains can’t continue indefinitely, as investors are rotating from expensive tokens to cheaper ones. The only thing left is to have technical confirmation for increased selling interest.
Resistance around the all-time high can be an early signal for the start of a push lower. We suspect BNB is now trading inside a range between $370 – $200, so there is plenty of room for both buying and selling opportunities.


There are no comments at the moment, do you want to add one?
Write a comment