
BTCUSD (Coinbase)
Last week we mentioned that if BTC weakens and moves back close to $60k, that will be a bearish sign. As you can see from the chart, once the price broke impulsively below the 4h chart 20 EMA, buyers failed to reverse the order flow.
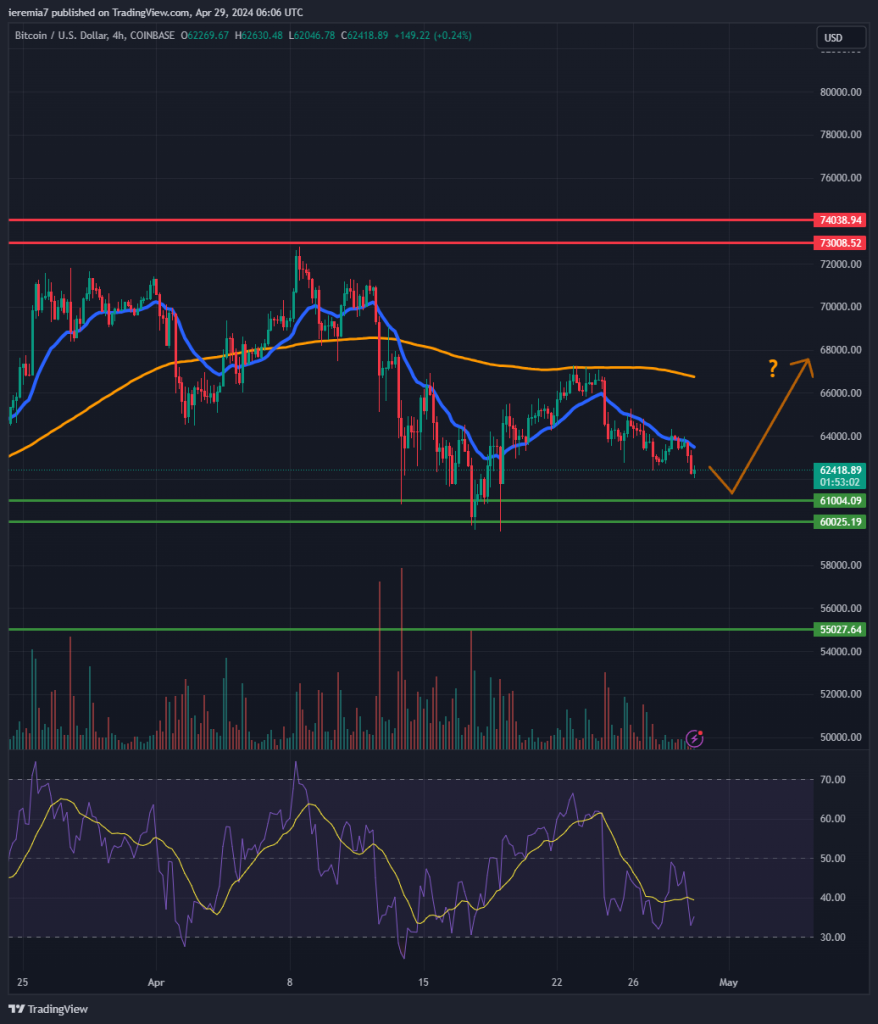
This is also the FOMC week, so pay close attention to the Wednesday press conference. That can generate a directional move that could last until the end of May. Technically, we haven’t breached the $61k – $60k key support area, which is why we view BTC in a consolidation mode.
Only if the price breaks and closes below $60k on a daily basis would we shift our downside target to $55k. For now, the dominant range is capped on the upside by $73, so if the bottom holds, that could be again on the cards.
Given the focus turns to the FED and how hawkish the rhetoric will be, traders aiming for swing trades, should wait and see. Intra-day traders, on the other hand, could still find short-term plays around the levels we’ve highlighted.
ETHUSD (Kraken)
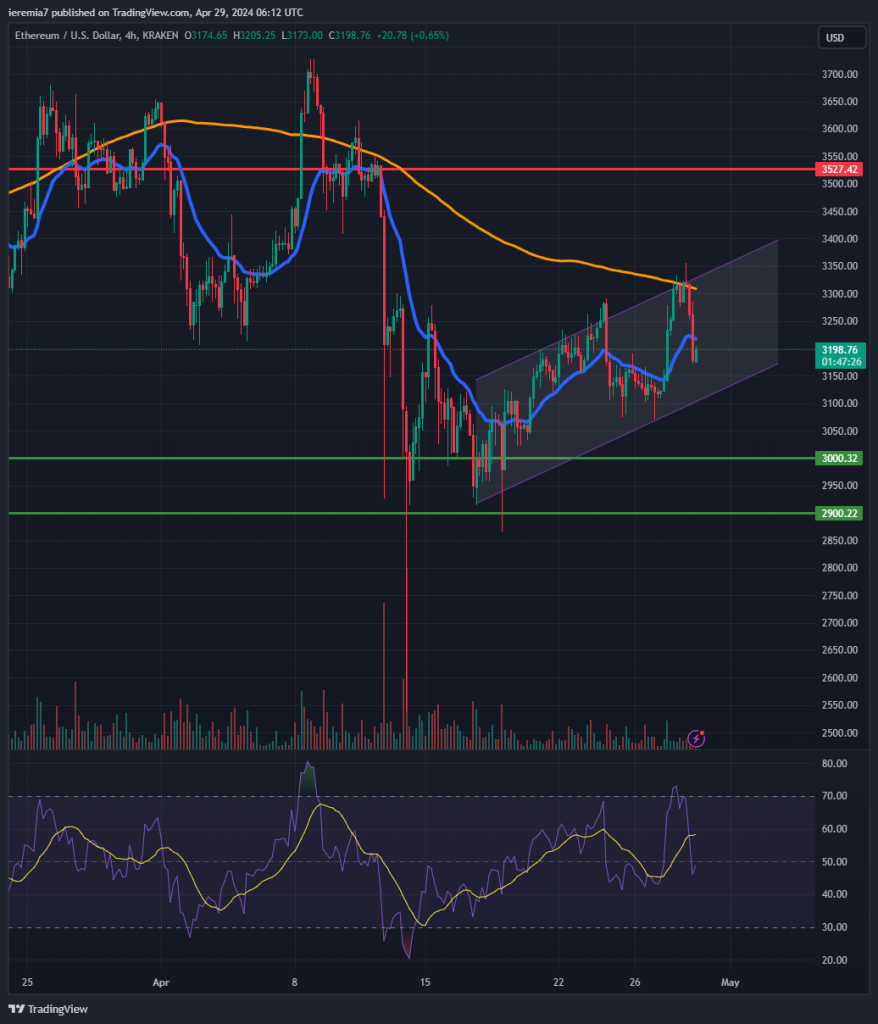
Ether is in a much better technical position since we see a short-term ascending channel + higher lows and higher highs. The price failed to break above the 4h chart 200 SMA, but it’s still trading above the key $3,000 area.
We think ETH is currently forming a bottom and the wild swings are normal. As long as the price continues to stay above the $3k – $2.9k area, we’ll keep our bullish stance in place. The first upside target, if the market finally breaks and holds above the 200 SMA, will be $3,500.
On the downside, breaking below $2,900 will be a bearish sign and in that scenario, our focus will shift towards $2,500 as the next major support. In the broader picture of things, ETH didn’t reach new all-time highs and it’s way cheaper than BTC, so investors are more inclined to consider buying this one when diversifying their portfolios.
SOLUSD (Coinbase)
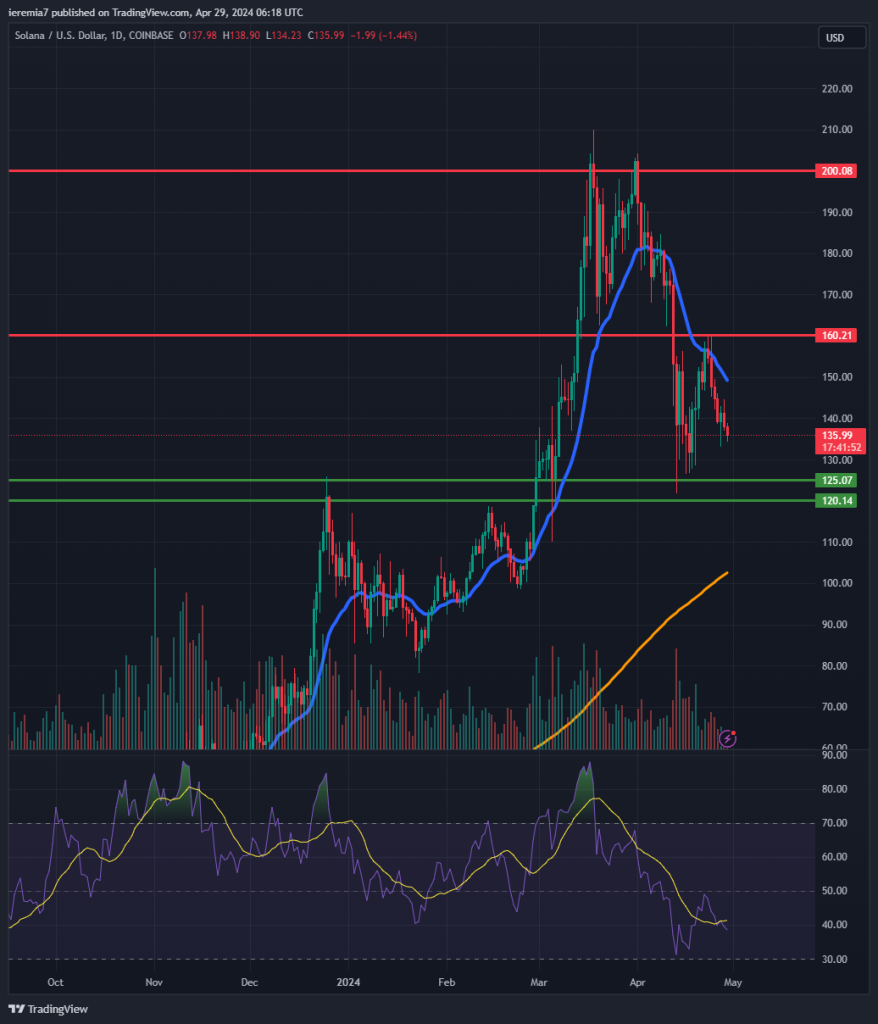
Solana continues to sell off after the impressive first quarter of 2024, showing that investors are cashing out and shifting attention to other altcoins. Despite a short-term pop, the market failed to break and hold above the daily 20 EMA.
In fact, the blue line was treated as resistance and after that, impulsive selling resumed. As a result, we think there could be more pain ahead. The first significant support stays around $120 – $125. An inability from the buy side to cap the downside will be an “all-clear signal” for further selling, which will put the daily 200 SMA in play.
We think there should be at least a temporary bounce around $100, considering how significant that level is. At the end of the day, the broad market sentiment matters as well.
On the upside, the daily 20 EMA is the near-term dynamic resistance level. Only after breaking and holding above it, buyers could hope for a $160 retest. As a whole, SOL is in a bad technical position for buyers.


There are no comments at the moment, do you want to add one?
Write a comment