BTCUSD (Coinbase)
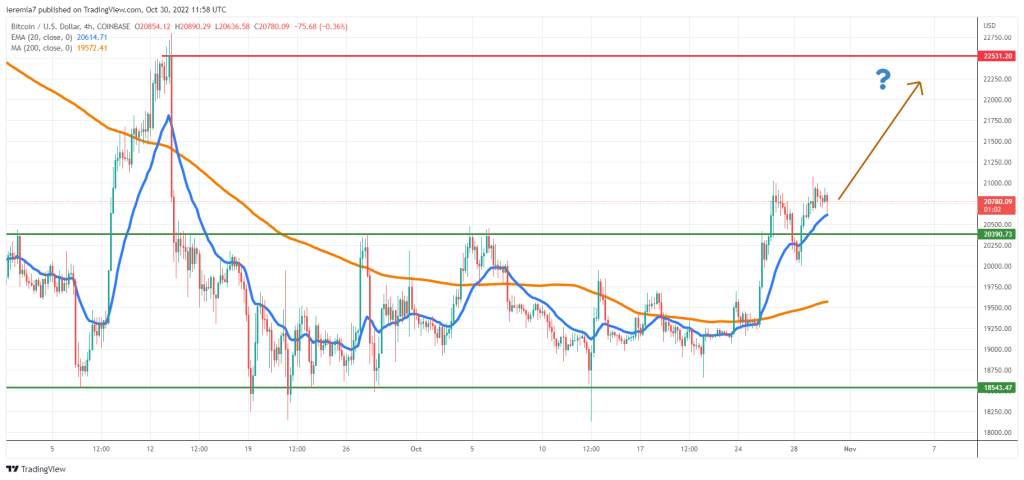
In line with our expectations, Bitcoin finally managed to stage a short-term rally, managing to break above $20,400 for the first time since September. The move was welcomed by the buyers and now that the sentiment has improved, small dips were treated as new buying opportunities.
As long as the price continues on the same note, we expect BTC to continue the upside leg. The first significant resistance is located around $22,500 where an impulsive slump occurred on September 13th.
Even if the market can go even higher than that, we would like to caution bulls from buying above that area, since this market is underperforming. The same goes with tech stocks, so as long as flows will go into defensive assets (like value stocks and bonds), crypto enthusiasts might be disappointed valuations don’t pick up more steam.
A downside reversal should not be excluded and sellers would aim to drive the price below the 4h chart 20 EMA first. In that scenario, Bitcoin can weaken towards $19,500, where the 200 SMA is also located. Bulls have a slight advantage right now, but be prepared for anything as next week we also have the FOMC.
ETHUSD (Kraken)
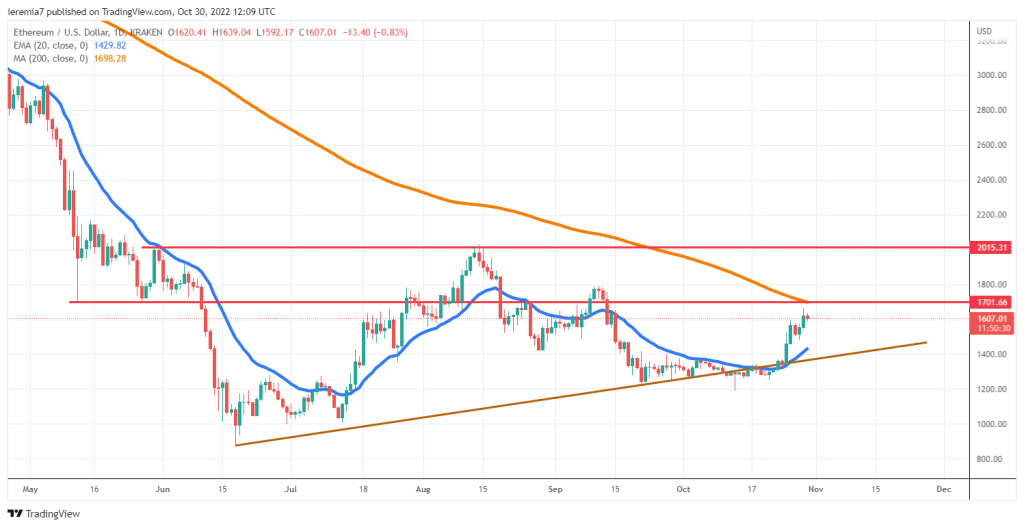
The bullish momentum can be spotted across the market and Ether is showing better performance as compared to Bitcoin. An ascending trend line going back to June continues to be in play, but we still have ground to cover on the upside until a bottom will be confirmed.
Resistance could emerge around $1,700 and $2,000, meaning bullish should be patient while prices trade near those levels. ETH continues to be below the daily 200 SMA, so the sentiment remains bearish.
On the flip side, a move lower can encounter support near the daily 20 EMA and also at the trend line. Although this week’s rally is encouraging, it’s not convincing enough to suggest the token is up to the races.
BNBUSD (Binance)
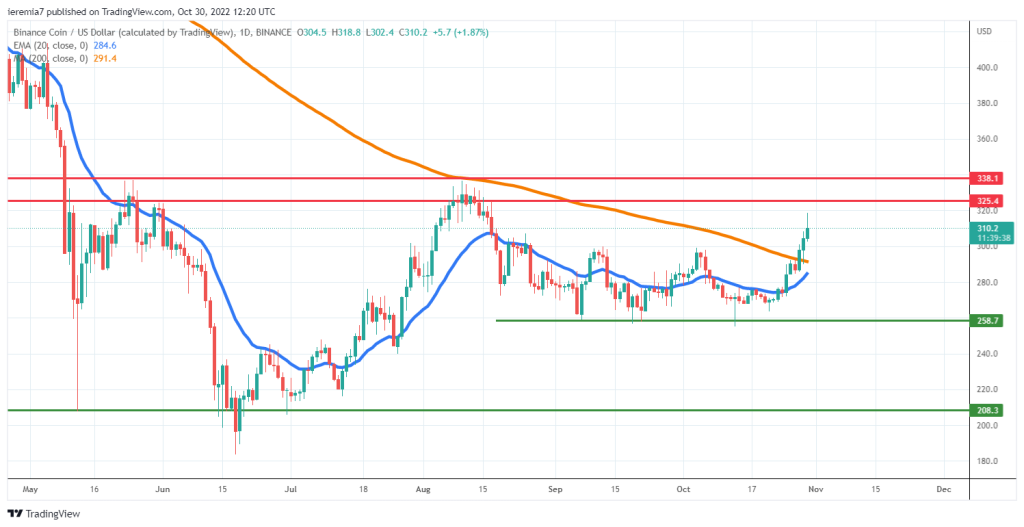
Binance Coin remains a gauge for the crypto market sentiment and as gains were seen across the market, one of the biggest exchanges benefits from larger trading volumes. The BNB price bottomed around $260 and it’s now seen at $310, after breaking above the daily 200 SMA yesterday.
We expect to see how buyers will react once the price gets near the $325 – $338 key resistance area. There are two important rejections off that zones in May and August, meaning that could happen again.
Conditions are slightly in favor of a break higher and continuation towards $350 – $380, but it’s imperative that this sentiment continues well into November. This time of the year is bullish for crypto, so even if we’ve had a rough year, market participants might be considering going long.
An impulsive break back below the daily 200 SMA is an early bearish sign you should watch for. In that case, sellers might resume in force, driving BNB towards $260. Breaching that short-term bottom is not something traders want, given that $200 would become the next target.


There are no comments at the moment, do you want to add one?
Write a comment