BTCUSD (Coinbase)
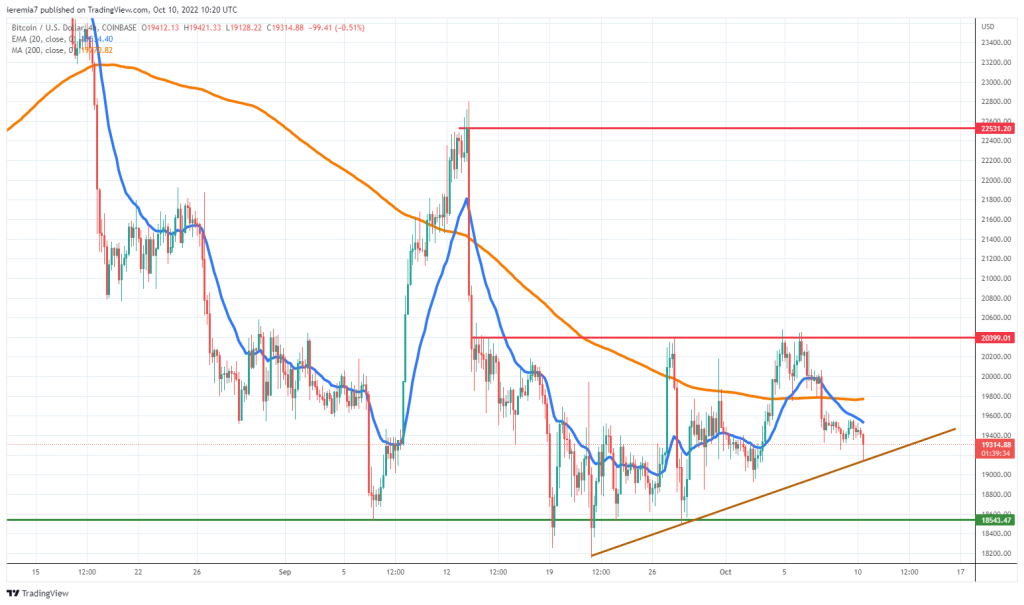
The beginning of October catches Bitcoin trading sideways and thus far, no major move seems to have started. That is despite the fact stock markets continue to head south on the back of economic worries.
BTC, on the other hand, managed to stabilize above $18,500 and it is yet to be seen if buyers can drive the price higher this week. We have a new batch of critical inflation data from the USA and that could impact the Dollar and risk assets. However, the news comes out at the end of the week, which leaves a few days during which anything is on the table.
There’s a short-term trend line already confirmed by the market and as long as that continues to be respected, we may see Bitcoin retest the $20,000 area. Else, the $18,500 support should be pressured once again.
If the upside scenario turns out to be the right one, we suspect there is further room to go, and $22,500 would be the first key resistance to watch. Failure to keep the price above $18,500 will further dampen sentiment and expose $15,000.
ETHUSD (Kraken)
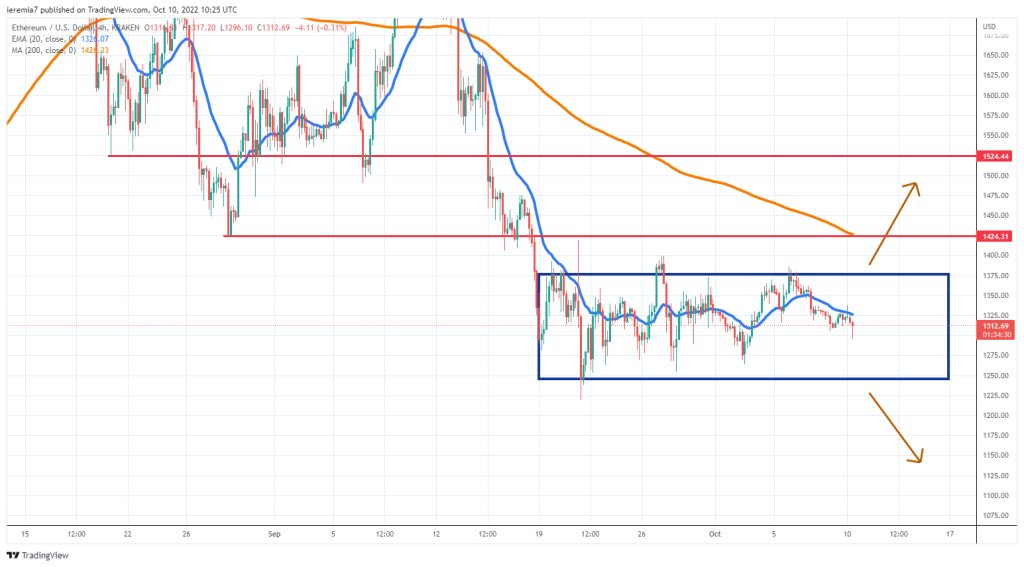
A week later, the range we’ve discussed remains in play, as the upper band acted as resistance. Sellers prevented a break above $1,375 and now Ether is struggling to stay above $1,300. The weaker selling pressure combined with a series of higher highs is slightly encouraging. Yet, buyers should not rush and wait for a clear break outside the structure, to have an idea of where the dominant order flow stands.
The 1,450 and 4h chart 200 SMA are levels to watch on the upside. The same goes for $1,500 a psychological resistance level that generated interest in the past. For buyers, the real test comes when $1,250 gets retested again.
In case Ether continues to move lower unhindered, that would be a bearish signal and buyers’ hopes will be tier to $1,000. More bids are expected there, but a continuation of the bear market during a positive seasonal period is not a good indicator.
XRPUSD (Kraken)
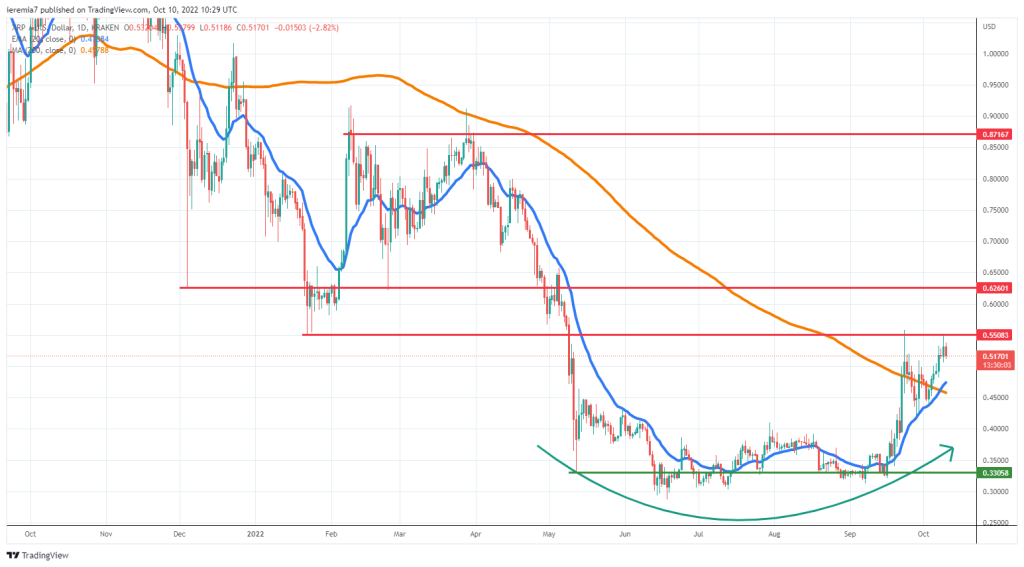
While most of the major tokens are sideways, XRP is up more than 16% over the past 7 days, suggesting buyers have shown a great interest in this crypto. Looking at the chart, we can see a nice rounding bottoming formation that drove the price more than 60% above the 2022 lows.
Sellers resumed and capped the upside around 55 cents, as they did in September, so now we wait and see if a break occurs. In that case, the move could extend toward 62 cents. XRP is trading above the daily 200 SMA and as long that continues to be the norm, the bias is bullish.
Dips should be capped by the SMA and if that won’t be the case, sellers will be the ones in control once again. Buyers should watch for rebounds around 45 cents and 40 cents. The lows of the year are under threat if those fail.


There are no comments at the moment, do you want to add one?
Write a comment