Bitcoin

Source: dailyfx.com
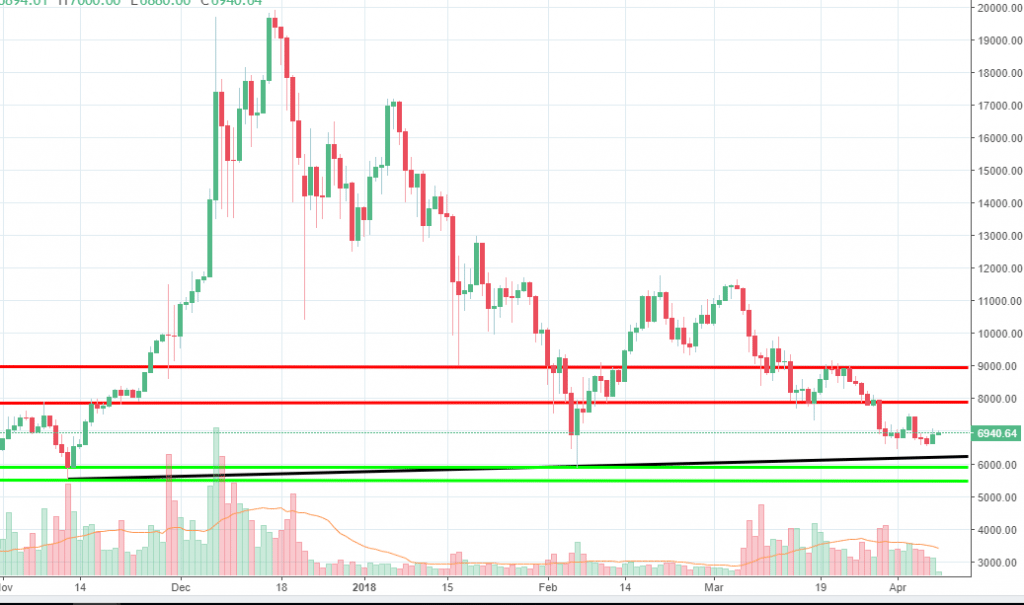
The Bitcoin price had not continued to dip at the same pace for the last week, which could signal buyers are balancing the order flow. The price action is now close to an ascending trend line we’ve spotted on the daily chart. It will be interesting to watch how the market participants will react around that zone. Thus far, cryptocurrencies had been heavily under pressure since the start of 2018, and some people are asking whether Bitcoin is really dead.
Even if the price action will manage to reach the trend line, we expect heavy support around. That is because we have the current year low, located around 6,000 + 5,500, another key support area.
We suspect that could be the starting point for a new leg up. On the upside, sellers are expected to resume impulsively around 8,000 and 9,000 areas. For now, we expect to see if the buyers will manage to regain control over the order flow around the above-mentioned areas.
Monero

Source: dailyfx.com
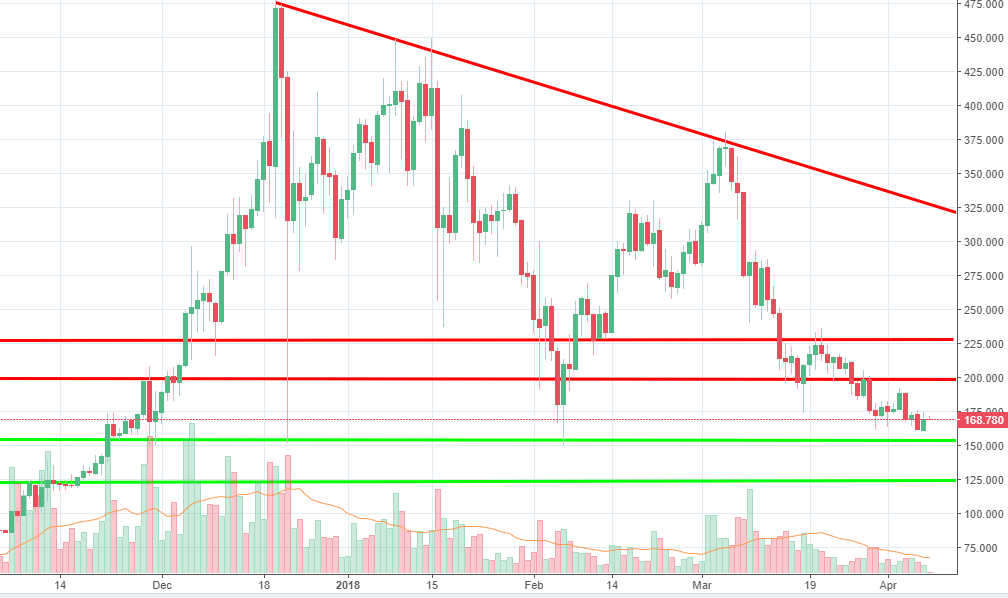
Similar to Bitcoin, Monero had moved on the downside, but at now the same pace, confirming that sellers are beginning to lose steam. Why is that happening? Because the price action is approaching a strong support area, a place where a strong upward leg had started at the beginning of February.
Because the buyers do not show any convincing sign at the present time, we expect the price action to continue lower. However, support is expected around the 150-153 area, which is where buyers had resumed impulsively in the past. A breakout below that zone will open more room towards 125 and it won’t be a good sign for buyers at all.
If our key support area located around 150-153 will hold, we suspect buyers will start a new leg up which will drive the price towards the 200 resistance. We are well below the descending trend line we’ve talked about a few weeks ago, which means the long-term bias remains tilted towards the sell side.
Ethereum

Source: dailyfx.com
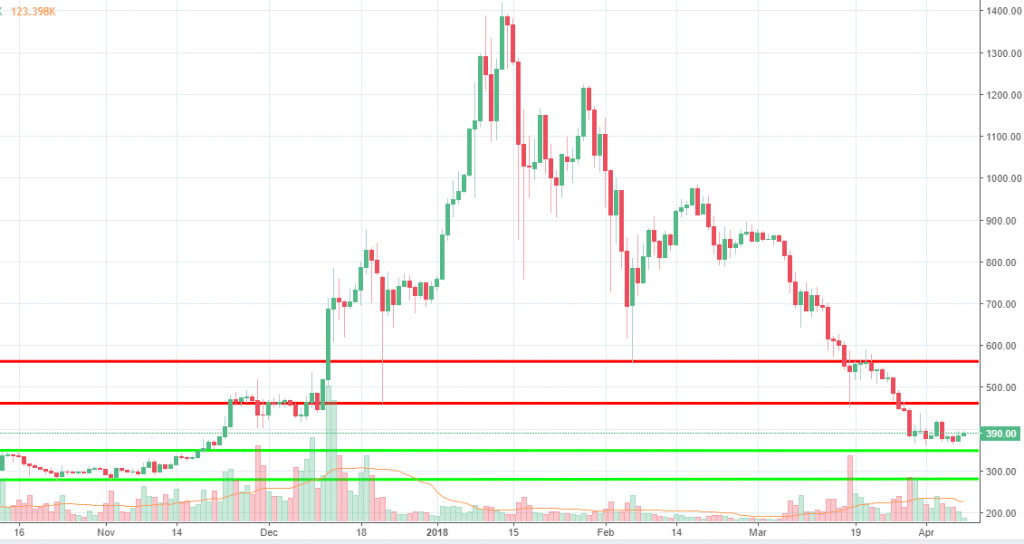
Probably one of the worst performing cryptocurrencies since the start of 2018, Ethereum had lost around 72% of its value, dropping from 1416 towards 360 area. Things are not looking great for the main rival of Bitcoin, and there are no signs of change right now.
If the sellers will continue to push the price action lower, we should see the 350 support area bringing some heavy buyers into the market. If that won’t happen, the drop could extend further, towards 280.
If the buyers will respond impulsively around 350, we expect a rebound towards the 465 resistance level to take place. No sign of impulsive buying right now, so the bias remains towards the sell side until any changes take place.


There are no comments at the moment, do you want to add one?
Write a comment