BTCUSD (Coinbase)

The new year is not unfolding as most people expected. Bitcoin is under pressure and the main reason deals with a strong USD and higher yields. This is dampening global liquidity and thus risk assets take a beating.
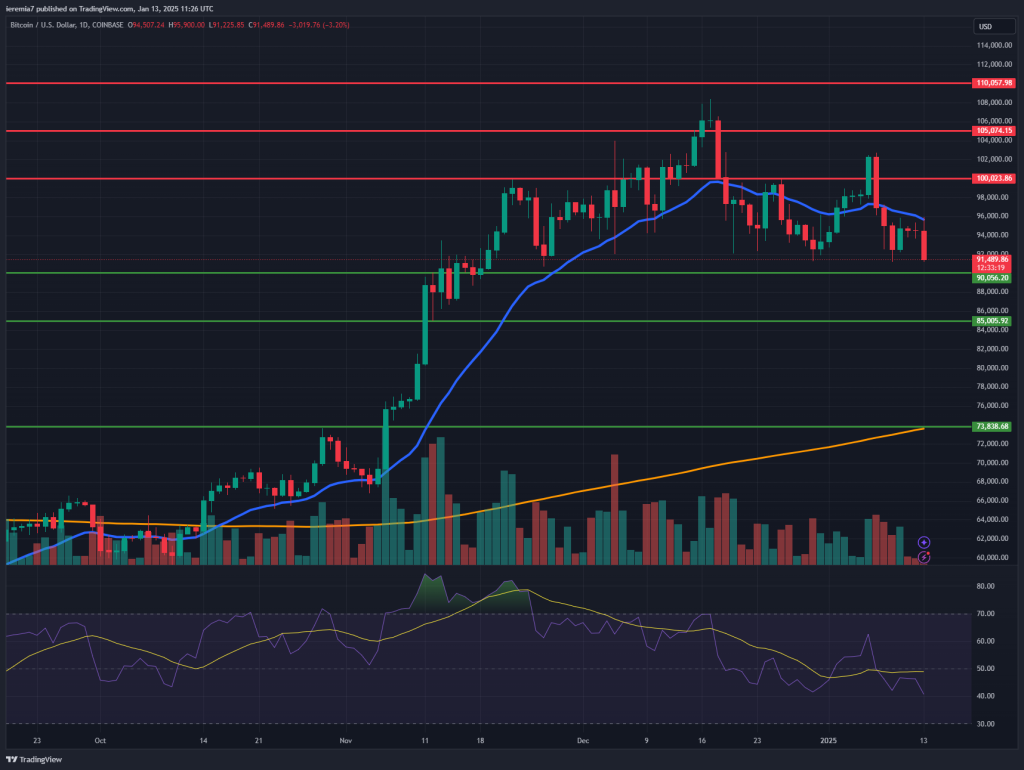
At the time of writing, BTC is hovering around Jan. 9th lows and we think a break lower is likely. The near-term support is $90k, but it won’t be a great idea to buy the dip there since we have critical US inflation data this week.
If the figures prompt further US Dollar strength, Bitcoin can keep moving lower until $85k. We believe the current selling is part of a broader move lower that might extend towards $74k. That’s a prior all-time high and role-reversal level.
On the upside, we need to see the price breaking and holding above the daily 20 EMA. That’s not the case so far, since each time BTC gets close to the blue line, it gets rejected. A break back above $100k will be an encouraging sign for buyers.
ETHUSD (Kraken)

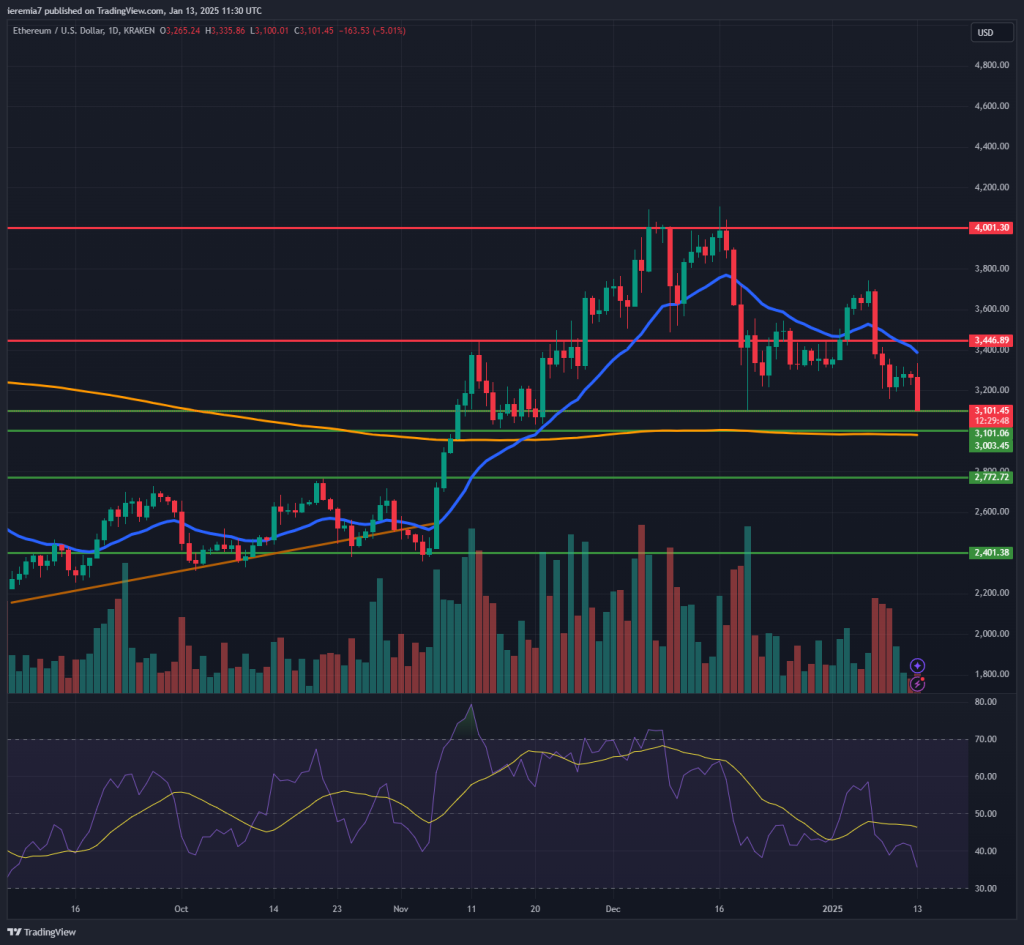
Ether is also under pressure, given traders dump crypto across the board. The price is now testing the $3,100 support, but the key challenge will be to keep valuations above $3,000. We say that because the daily 200 SMA is also located there and further selling below might accelerate the bearish move.
As things stand right now, a bottoming is not showing signs of forming, so we believe this could turn out to be another bearish week for ETH. Breaking below $3k will mean attention shifting to $2,700.
On the upside, we want to see the price breaking above the daily 20 EMA, something hard to materialize at this point, since we continue to see financial conditions tightening. Ironically, some bad economic data could be good for liquidity, since that will dampen yields.
LINKUSD (Kraken)

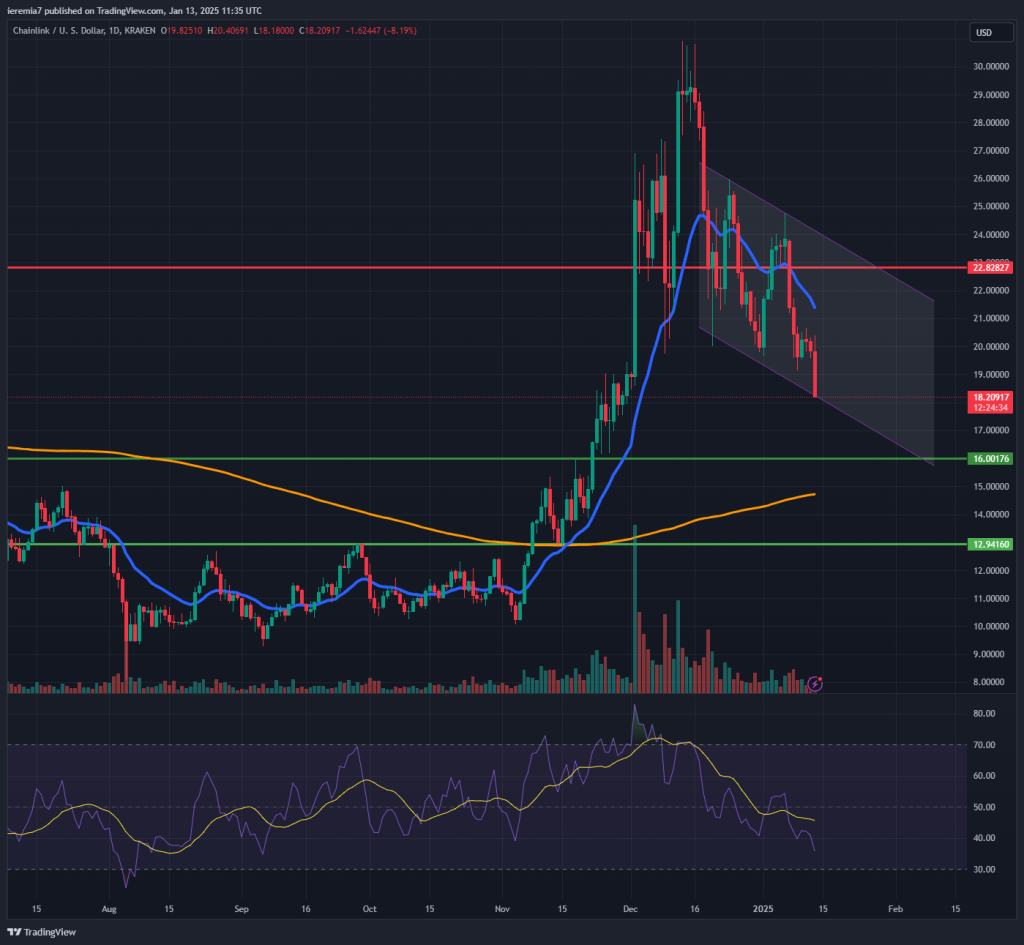
Chainlink is falling rapidly today and there is scope for further selling during the week. The price treated the key $22.8 area as resistance and now sellers are the ones in control. Keep in mind that RSI on the daily chart continues to trade above the oversold area, so there is some more room to go before buyers step in.
We don’t advise dip buying at this stage since the closest strong support is $16. That’s another 15% from the current price. At the same time, buyers need to watch for a retest of the daily 200 SMA. Although it might not suggest a trend reversal, we could see a bounce once the market reaches the orange line.
The price action context is not favorable for bulls, but at some point, the price will start heading higher. You should watch for exhausted selling into key support areas if your goal is to buy LINK expecting a reversal higher.
If you just want to trade the coin short-term, it would be better to stick with the dominant market direction which is down until further notice.


There are no comments at the moment, do you want to add one?
Write a comment