
Bitcoin
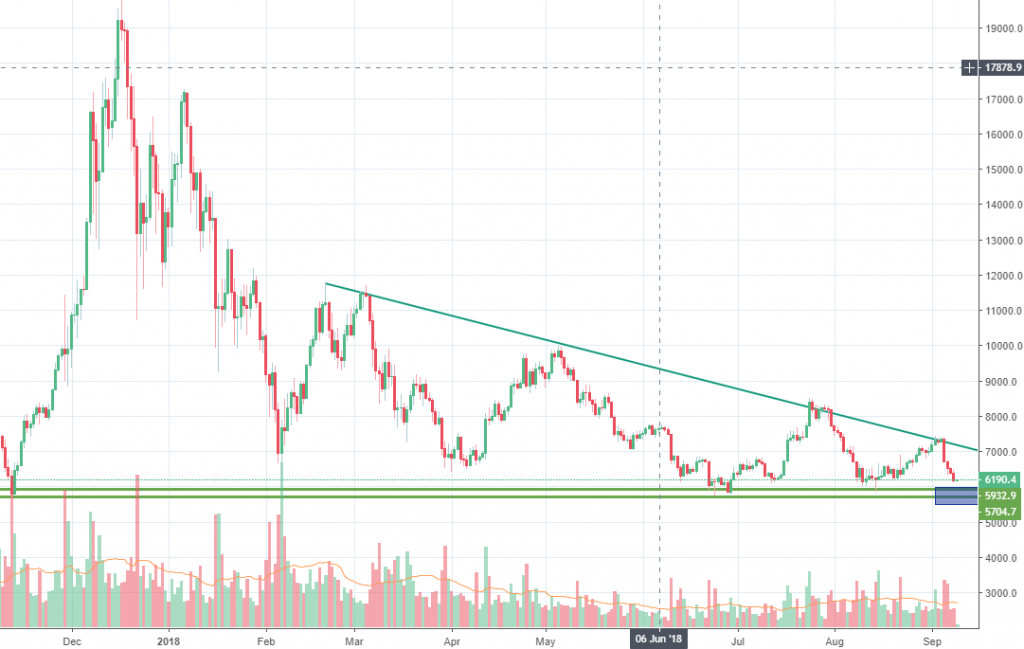
Source: tradingview.com
Another red week for Bitcoin is about to end, after a news suggesting that Goldman Sachs will give up on its plans to open a Bitcoin trading operation. The price started to dip aggressively after almost reaching the 7,400 figure and at the time of writing is located at 6,190, very close to a key support area.
We will use the daily chart this time since the price is approaching some key levels. If you look at the chart above, you will notice that since the beginning of February the Bitcoin price had been stuck in a downward triangle pattern, with several bullish failed rallies notable.
As the price is heading south, we expect it to reach the 6,000-5,770 key support area, where each leg down had been capped thus far. On the upside, the downward line should be a place where sellers might rejoin the trend.
We must also mention that each bull run had been weaker than the previous one, which is a very bad sign for buyers.
Ethereum
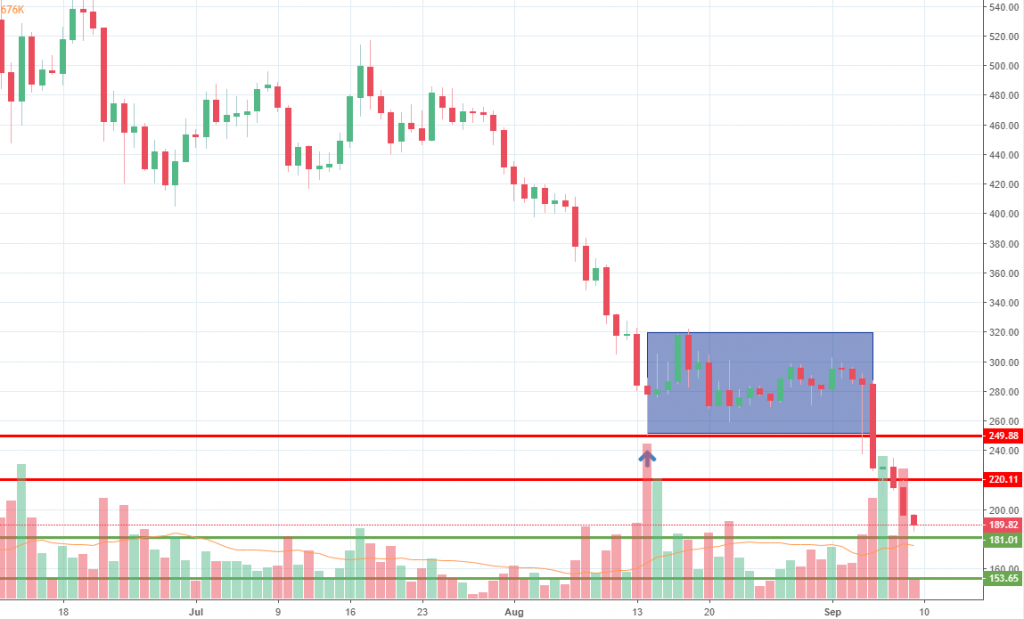
Source: tradingview.com
The current Bitcoin selloff had put pressure on Ethereum as well, bringing the price to levels not seen since July 2017. Once the first September trading week kicked in, the price resumed the downside, breaking below a consolidation structure highlighted on the chart above.
If the leg down will continue to extend, we expect it to encounter greater buying power around 181 and 153 support levels. We can see strong reactions around them occurring last year, so keep a close eye on them.
On the upside, 220 is a previous 2018 low and the bottom of the consolidation structure, so it should act as resistance if the bulls managed to rebound.
Thus far, the leg down is very impulsive, with the red candles much bigger than the green ones. Not the best time to buy, given this strong bias towards the sell side.
Bitcoin Cash
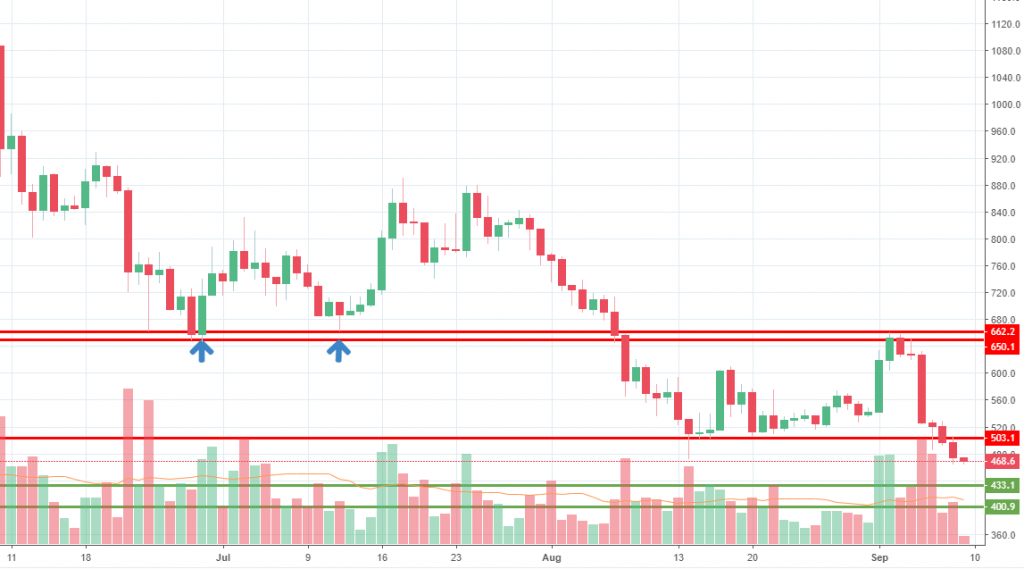
Source: tradingview.com
In our last weekly crypto analysis, we have included Bitcoin Cash and that time we wrote about the 650-662 as a very important resistance area. As you can see from the chart, the price slumped for seven consecutive days since then, weakening by more than 20% in the last week.
The 2018 low had been breached yesterday and now the price seems like it will head towards 430 or 400 psychological area, where buyers might kick in again.
On the upside, we expect resistance around the 503 level, but looking at the current price action structure, buyers are having a hard time in the market.
Seven consecutive days of selling points towards the fact that Bitcoin Cash could weaken further in the following days, which puts buyers on hold for a little while.
Briefings about ICOs
According to icowatchlist.com, an ICO project that will end in a day is Sansox. The project wants to bring the power of clean water through the efficient use of technology powered by blockchain.
KamaGames is a blockchain-based project that aims to be a company that provides in-game sales of services to its users. The ICO will start on September 24th.


There are no comments at the moment, do you want to add one?
Write a comment