
BTCUSD
Source: tradingview.com
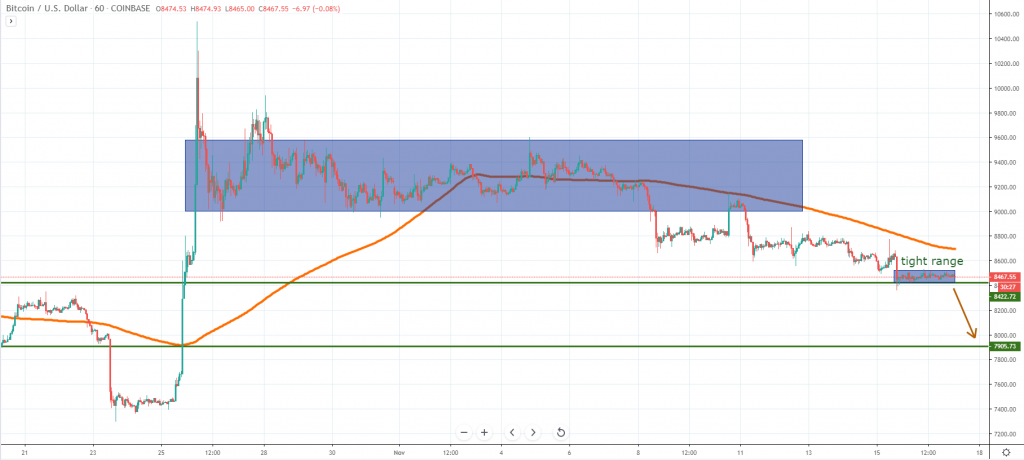
We’ve warned since two weeks ago that what’s happening with Bitcoin is a textbook “pump and dump” scheme and the price action development confirms our view. Exactly how we’ve talked in the last week crypto analysis that Bitcoin will retest the broken range and then head south, which is exactly what happened. At the time of writing, the Bitcoin price is locked in a tight range which makes a continuation lower the most likely scenario.
A break below $8,400 will open the door towards $7,900, our next significant support area. On the upside, the 1h chart 200 moving average should cap any significant bullish move. We believe any spike on the upside will be just a new opportunity to sell, given how the bigger picture looks right now. Also bear in mind that we usually see volatility spiking during Sunday, which means later today we could see activity in the market.
ETHUSD
Source: tradingview.com
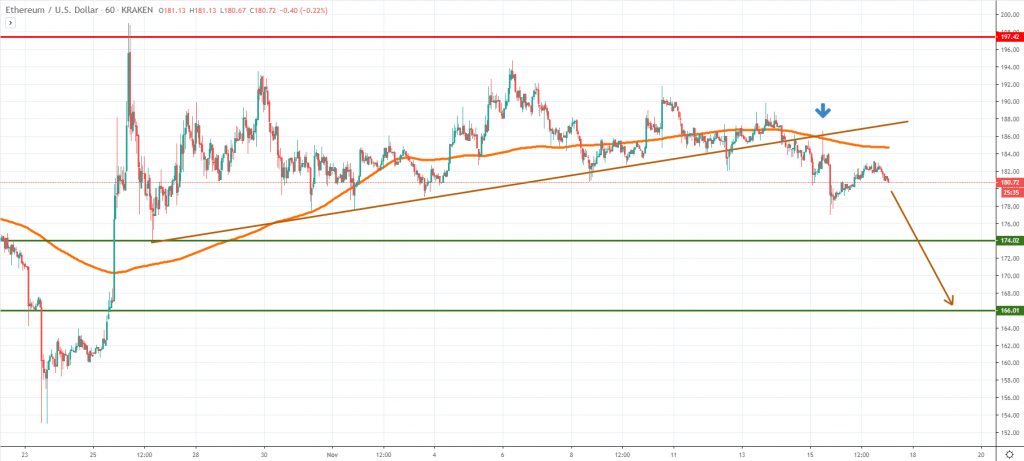
The negative mood in Bitcoin had spread to other large-cap tokens, including Ether. The price broke below the trend line mentioned in our last weekly crypto analysis and now it looks poised to head south for the next few days. Unfortunately for buyers, the breakout had been confirmed by a retest of the broken trend line + we have the price now trending below the 1h chart 200 moving average.
Our first downside target is located around $174, followed by $166, if the selling will further accelerate. On the upside, we believe the 1h chart 200 MA should be the main resistance, while a new retest of the broken trend line is not excluded. However, we believe the upside will be limited and Ether will continue to head lower. The picture in Bitcoin is very negative and any impulsive selling will affect Ether as well.
XRPUSD
Source: tradingview.com
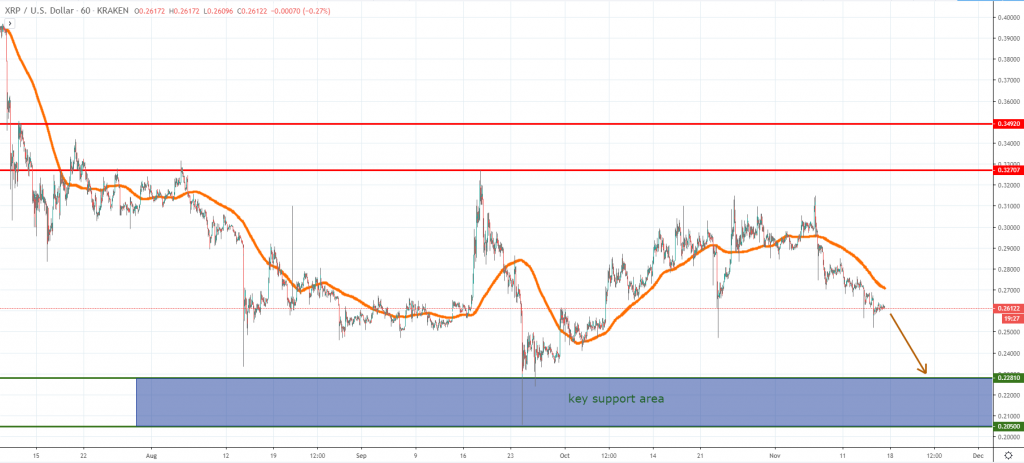
October had been a positive month for XRP, but the bearish sentiment seems to have affected the price for the past two weeks. The coin now looks set to retest our major key support area located between 20.5 cents and 22.8 cents. Last time the price reached it we had impulsive buying afterward and that could happen again.
We suspect the XRP price will continue to trade in a range between that zone at the 32.7 cents resistance until 2019 will end, unless there will be major news sparking volatility. At the time of writing, we see a short-term bearish parabolic structure continuing to unfold, which means there’s more downside insight.
Only a strong break above the 1h chart 200 MA could revive some hopes, but that could be tricky since sellers might treat it as a new opportunity to get short. We suggest traders to wait until XRP will reach the key support and only then make trading decisions.
Briefings about ICOs
The Soraix ICO will continue until November 24th, as it attempts to provide a solution for share in their revenue. Holders of SRX tokens will be able to trade using a 1:1 peg against Equity tokens issued on the company’s platform.
Amazonian Green Coin ICO will start on December 1st, aiming to provide a payment token used to purchase products and services offered by eco-friendly companies, and to buy environmental assets, or to contribute to environmental projects.


There are no comments at the moment, do you want to add one?
Write a comment