
BTCUSD (Coinbase)
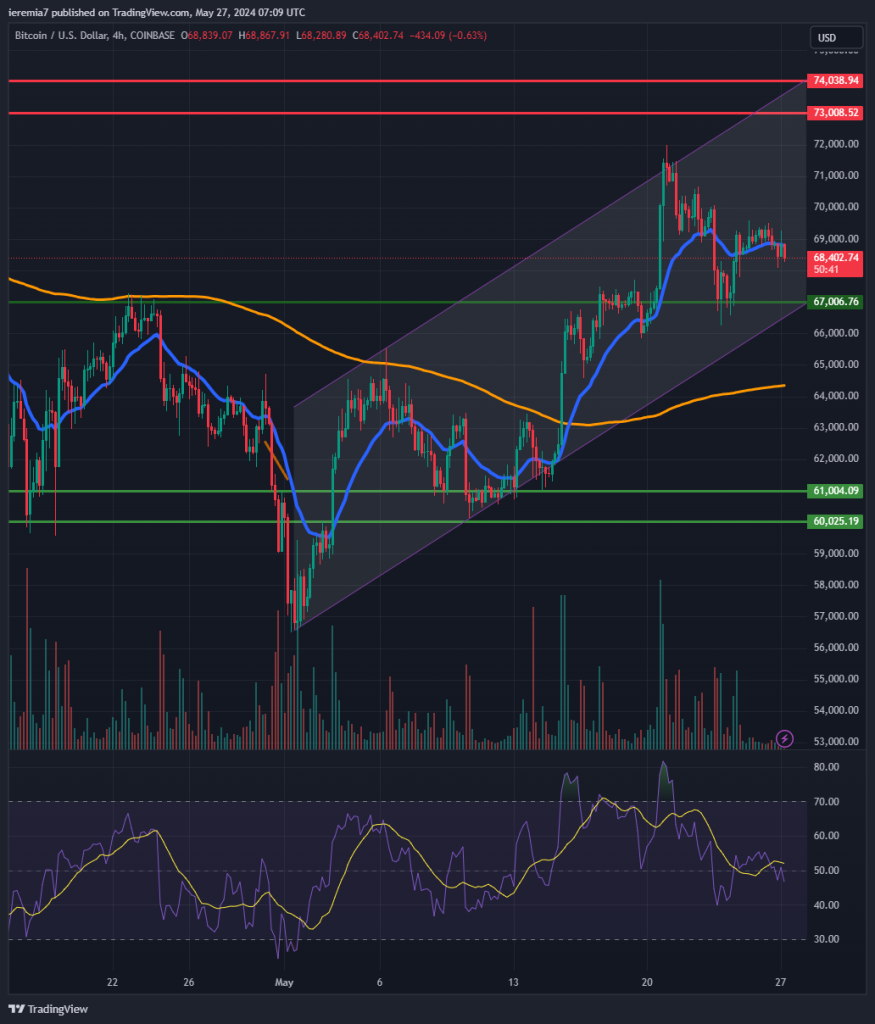
Bitcoin continued to rise last week and after breaching the $67k level, the price surged towards $72k where it found resistance. As BTC pulled back, $67k acted as a role reversal level, capping the downside.
Additionally, as our chart shows, the market is trading inside an ascending channel, which is another bullish sign. As a result, the $67k support is now backed by the lower line of the channel as well.
Only after the price breaks below impulsively, should we expect further selling towards the 4h chart 200 SMA. At the time of writing, the RSI is weakening, which shows some softness, but be aware there are holidays across the Western world, so volumes are subdued.
If the price continues to trade inside the channel and rotates upward once again, then attention will shift towards $73k. That will be very close to the ATH and could be an opportunity for bulls to drive the market even higher, which will act as a self-reinforcing pattern for new buying.
ETHUSD (Kraken)
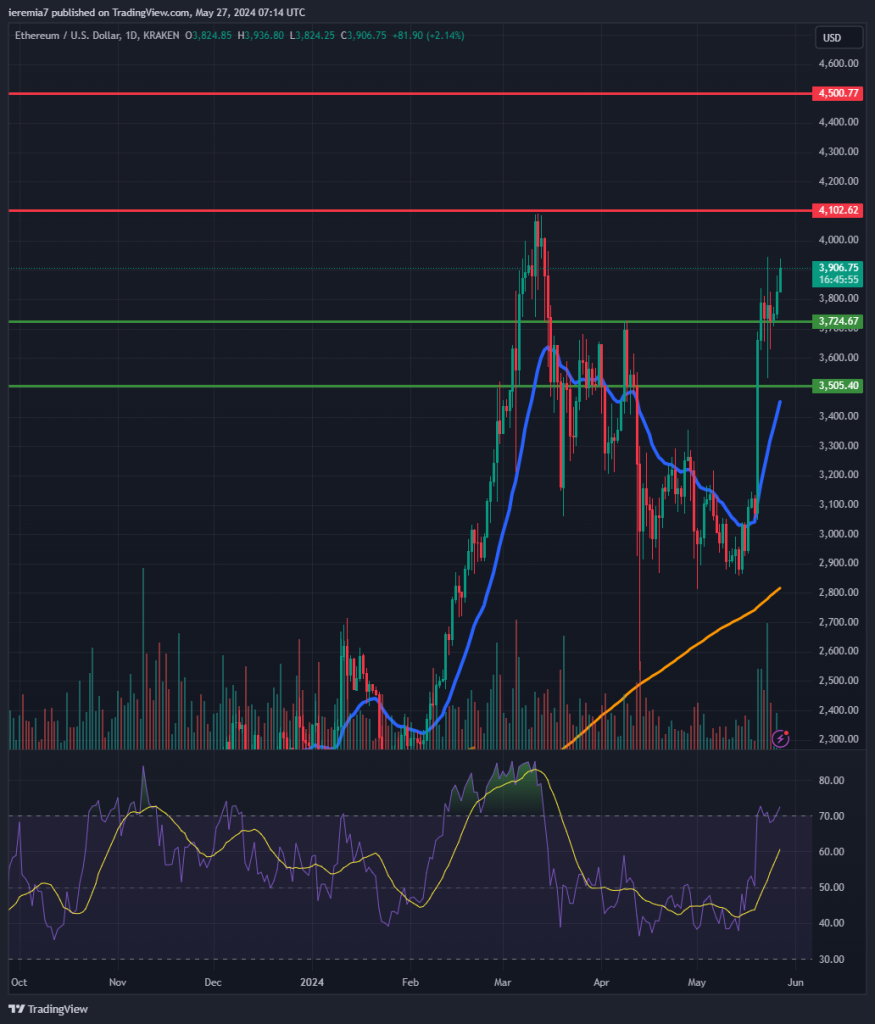
Ether’s momentum was very strong last week on the back of renewed enthusiasm for a US-listed ETF. We can see how the price surged and easily broke above $3,500, which leaves us the impression that there is more ground to cover for buyers.
The next short-term resistance is located around $4,100, or the March 2024 high, but as the price action unfolds at this stage, we can’t recommend shorting the market there. Maybe buyers who were confident enough to buy earlier might want to trim their exposure around that level.
We think there is a high probability for a breakout and continuation higher, which will make $4,500 the next key resistance zone. On the downside, we expect $3,700 and $3,500 to act as support levels. As May wraps up, there could be some profit-taking and consolidation, but the overall picture continues to be favorable for bulls, not the bears.
SOLUSD (Coinbase)
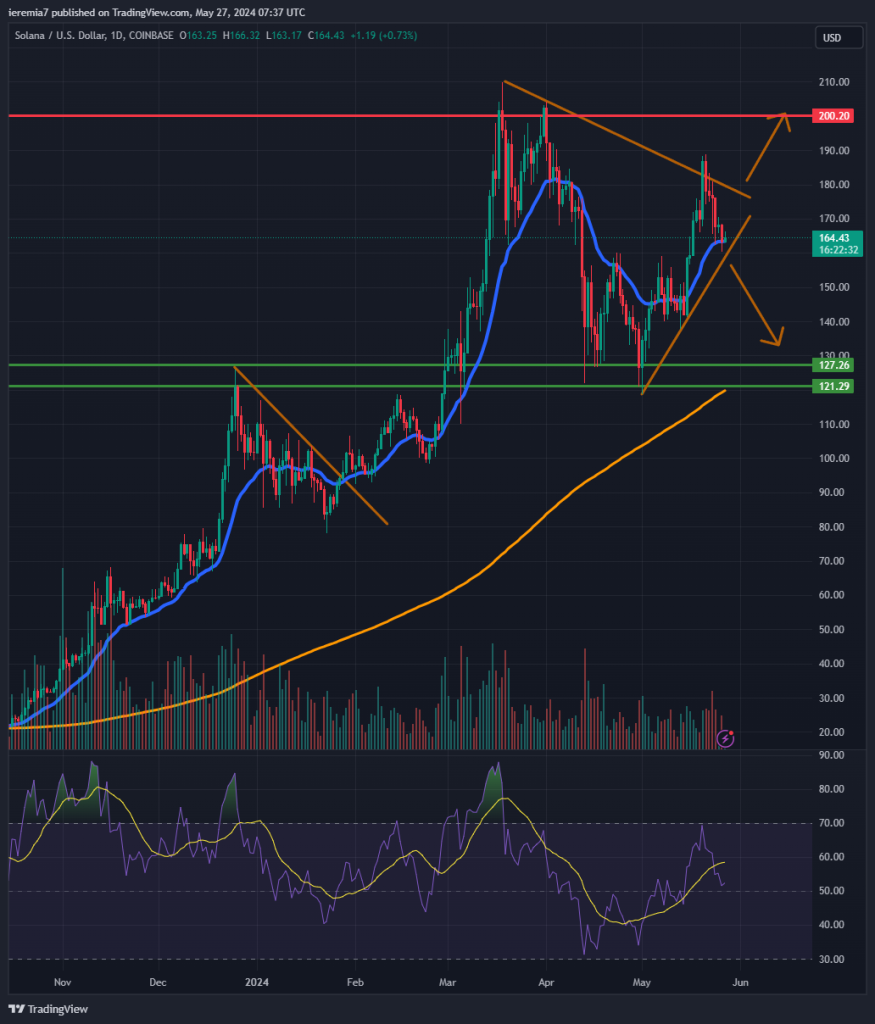
Solana is down 7% in the last week, but that doesn’t speak too much about the overall picture. As we can notice, the market is still in an uptrend, locked inside in a triangle formation. The ranges and volatility are now compressing, which leaves up to wait and see where the breakout will occur.
If the price breaks on the upside, then our next key resistance will be $200. It’s a psychological level and also a place where the market failed to break twice this year. In case SOL gets to that area, we think the likelihood of a continuation will increase and the market will shift focus towards $220.
Conversely, if the 20 EMA and the ascending line of the triangle fail to act as support, further weakness should be expected. Even if that’s the case, the larger bull trend remains in place as long as the price trades above the $121-$127 key support area. We’ve mentioned that zone in the past and as you can see from the chart, it managed to cap the downside successfully on two separate occasions.


There are no comments at the moment, do you want to add one?
Write a comment