
BTCUSD (Coinbase)
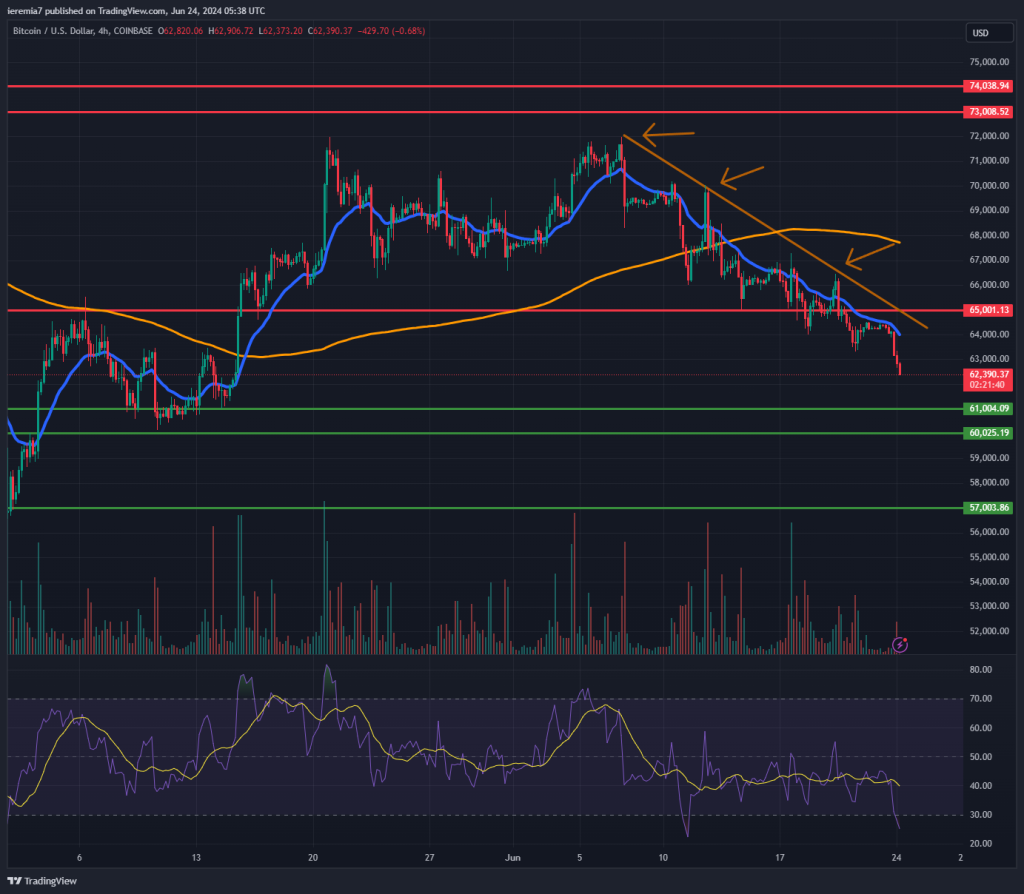
Bitcoin selling intensified last week and the price broke below our support at $65,000. Additionally, as the chart above shows, BTC continues to respect a bearish trend line and treats the 20 EMA on the 4h chart as resistance.
Those signs suggest the bears are in control and we would need to see a strong reaction from the bull-side of the market first, before claiming the sentiment reversed. So far, that’s not the case and Bitcoin seems to head towards the key area at $61k – $60k.
Keep in mind that this is not the best seasonal period of the year. That will happen in autumn, so until then, the market might be range-bound. Let’s see if the move extends lower and how the key support acts. Further selling below it could mean $57k will be next in line.
On the upside, a change in sentiment will mean the price treating the 20 EMA as support instead of resistance. Additionally, BTC has to break above the trend line. Bear in mind that $65,000 is no longer support and it’s possible the market could treat it as resistance if a bounce happens.
ETHUSD (Kraken)
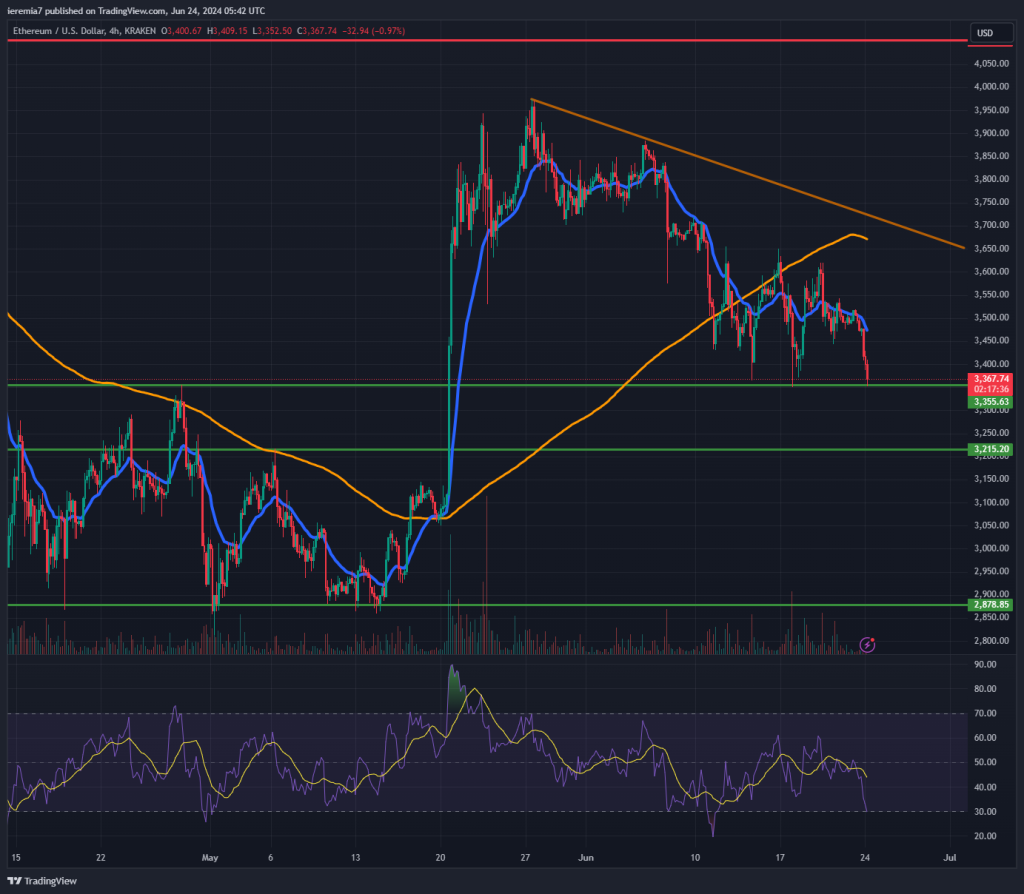
Ether enthusiasm continues to fade and based on the recent price action structure, this isn’t the right setup for bulls. The market is moving down in a parabolic way and as we write our analysis, bear threaten to break below $3,350, a key support we’ve discussed in the past.
That is very likely to happen and then, the focus should shift to $3,215 and $2,900. As long as the SEC continues to delay the launch of an ETF, there is no reason to believe that a rebound is likely.
Shorting ETH could also turn out to be tricky, given positive news might unleash a wave of buying, trapping sellers. Based on current conditions, though, the market looks poised for further losses. As June unwinds, expect more choppiness in the upcoming days.
ADAUSD (Binance)
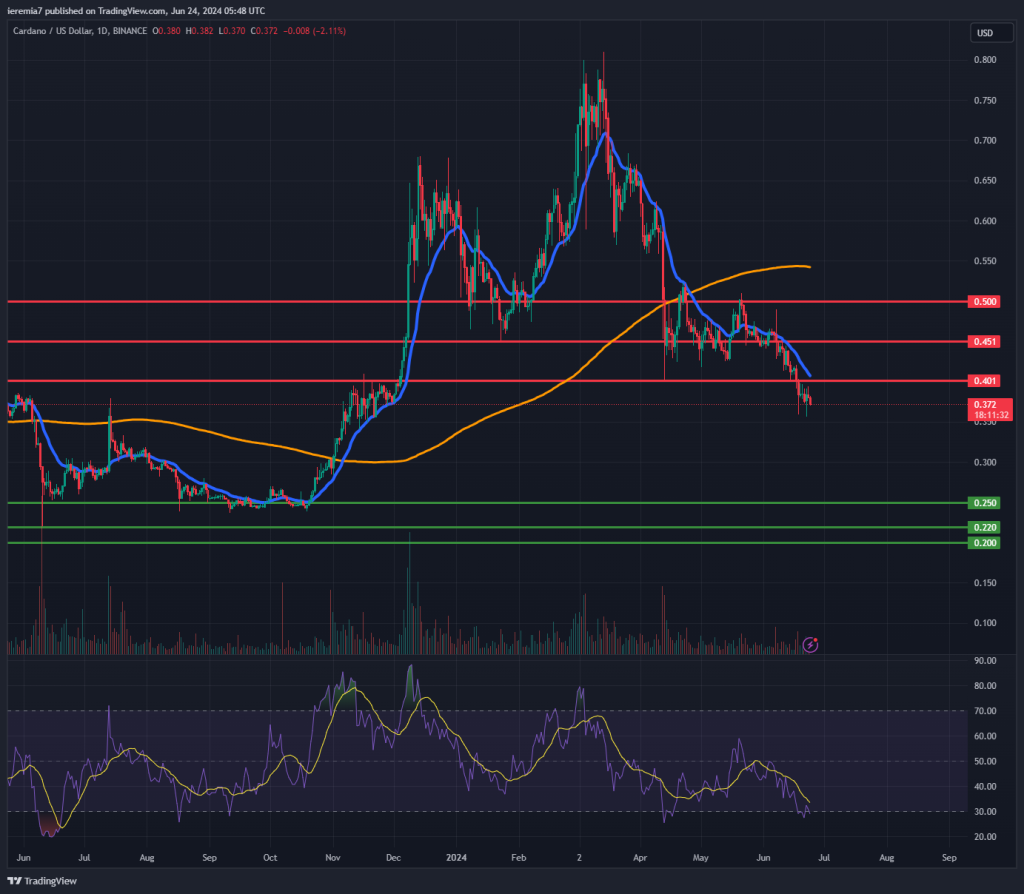
Cardano is down 54% from the March highs, suggesting sellers are overwhelming buyers. The price breaks below support levels, generating lower lows and lower highs, prompting us to suggest there is more downside ahead before a meaningful rebound occurs.
Judging by the daily chart, a likely target for the mid-term horizon is the 25 cents area. We would also like to highlight 22 cents and 20 cents as other levels of interest where strong buyers could get back into the market.
Until then, a rebound won’t happen until the price breaks and holds above the daily 20 EMA. As our chart shows, sellers are actively dumping ADA before the price even touches the EMA, showing how impulsive the selling is.
We view the 40-cent and 45-cent levels as key resistances. Given momentum is still favoring sellers, expect any temporary bounces into these levels to be met again with strong selling pressure. We don’t recommend fighting the trend at this point, given you might get trapped for a long time until the market finally rebounds higher.


There are no comments at the moment, do you want to add one?
Write a comment