
BTCUSD (Coinbase)
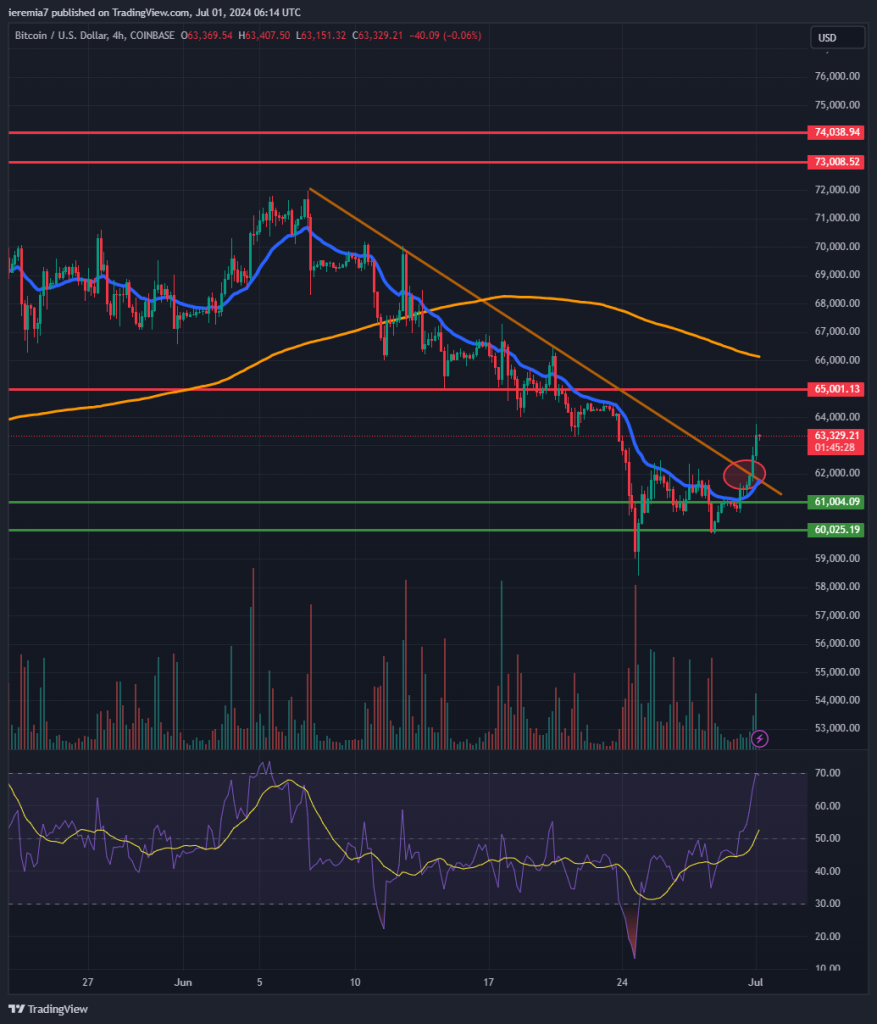
In line with our last week’s projections, Bitcoin continued to weaken and found support around the $60k – $61k key area. Despite a temporary break, the market could not keep the price below that zone for more than four hours. Additionally, we are now seeing further signs of improvements, considering the price broke above the 20 EMA and the bearish trend line on our chart.
That’s positive news for bulls and we should see follow-through buying as traders get back from their holiday break and liquidity increases. The RSI is close to overbought territory on the 4h chart, but that shouldn’t be a cause of concern for now, given that we’ve seen the indicator overbought for extended periods.
A key resistance area comes around the $65k level and the 4h chart 200 SMA. If buyers manage to overcome that, the focus will turn back to the $73k – $74k resistance zone, where the ATH is also located.
We see little chance for an impulsive push lower, as long as the price continues to trade above the broken trend line. Still, if we do see Bitcoin weakening below $60k, that will be our initial reason for concern.
ETHUSD (Kraken)
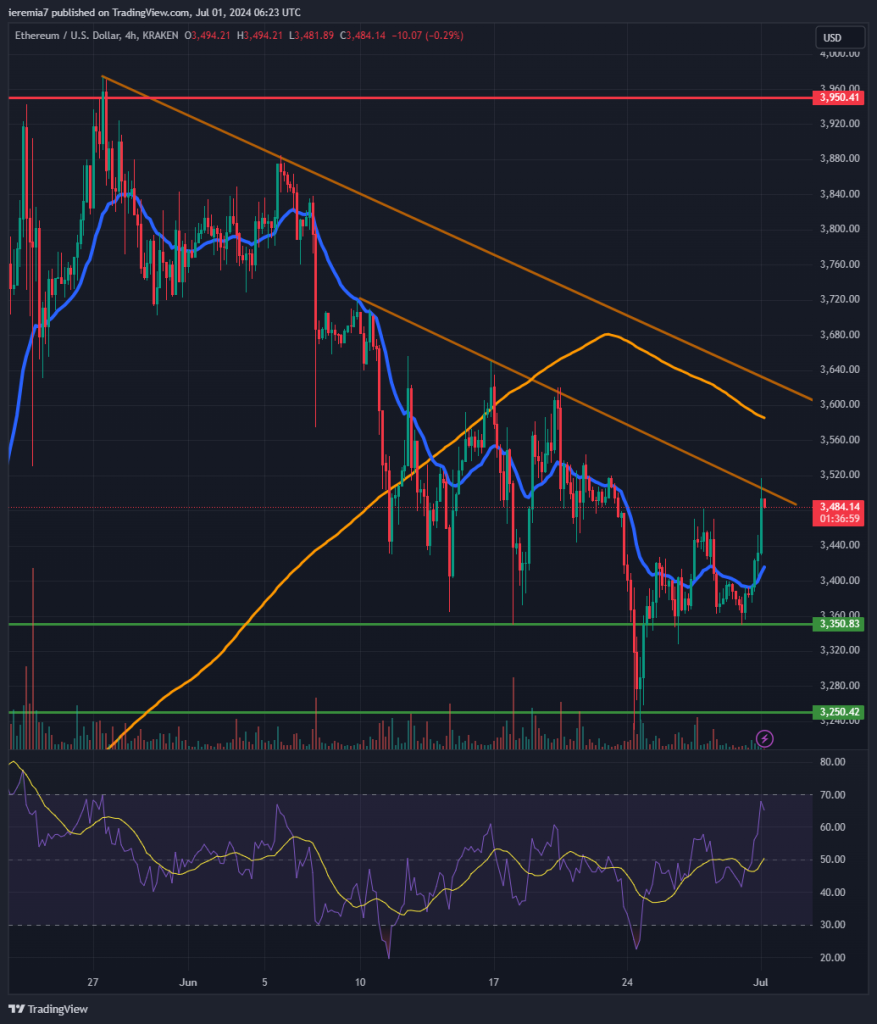
Positive signs are emerging in Ether as well, given we saw the market reacting to the $3,350 – $3,250 key support area + higher lows and higher highs on the 4h chart. However, we can’t say it’s all smooth sailing on the upside, considering ETH continues to trade below two key bearish trend lines.
The price already tested the first one and if buyers resume with an upside break, attention will shift towards the 4h chart 200 SMA and our second trend line. Clearing the 2nd trend line is the signal needed as confirmation for a resumption of the bullish trend.
In that scenario, ETH could continue up towards $3,950, as the summer should be calm and will likely lack major news that could move the market. At the same time, daily ranges are expected to contract gradually, until volatility picks up once again close to autumn.
On the downside, buyers are expected around $3,350 and $3,250. Should we break below them, $3,000 is the next key support area to monitor. We give an edge to buyers, given current price action conditions.
TRXUSD (Bitfinex)
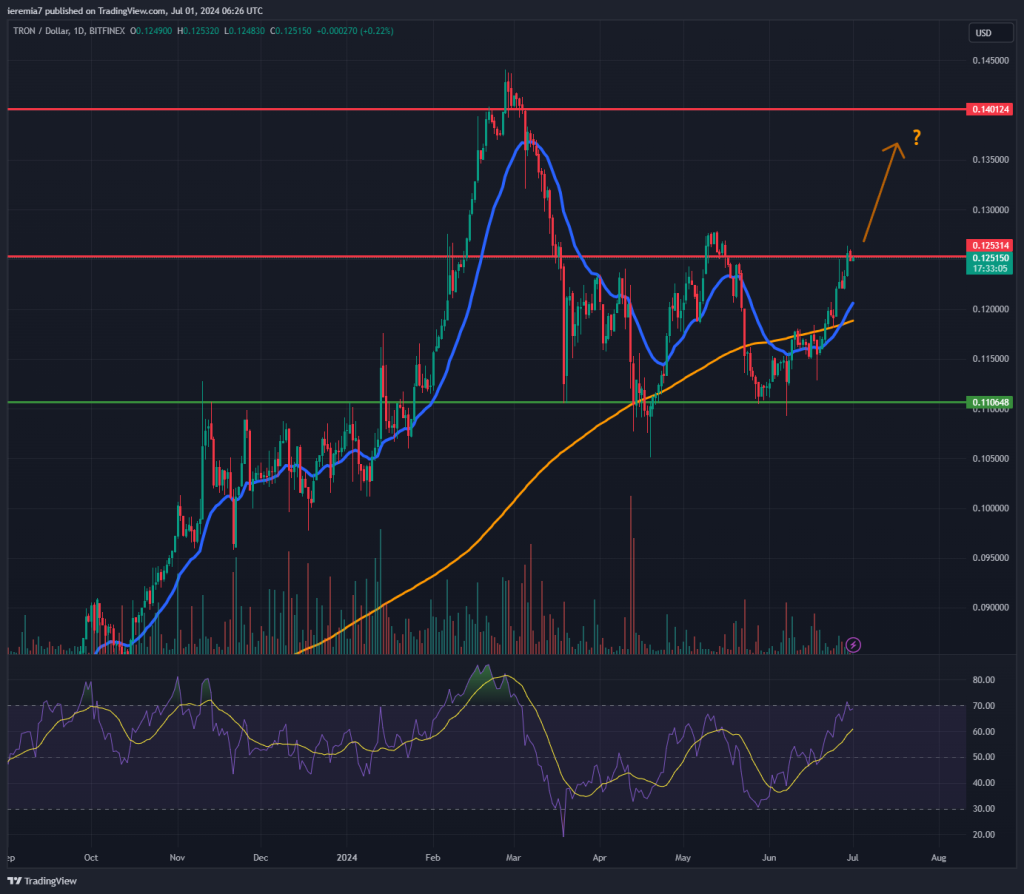
It seems like the bullish sentiment is seen across the entire crypto space, with altcoins posting larger gains than Bitcoin and Ether. This week we want to draw your attention to Tron, a coin that looks to be bottoming after several months of consolidation.
Looking at the chart, we can easily see how the 11 cents support acted as a bottom and as we write this analysis, bulls are pressuring the 12.5 cents resistance level. Managing to break above the May 13th high will be a bullish signal and will unlock further upside potential towards 14 cents. This is a cheap altcoin and even traders with limited capital are able to trade it, regardless of whether they want to use leverage or not.


There are no comments at the moment, do you want to add one?
Write a comment