
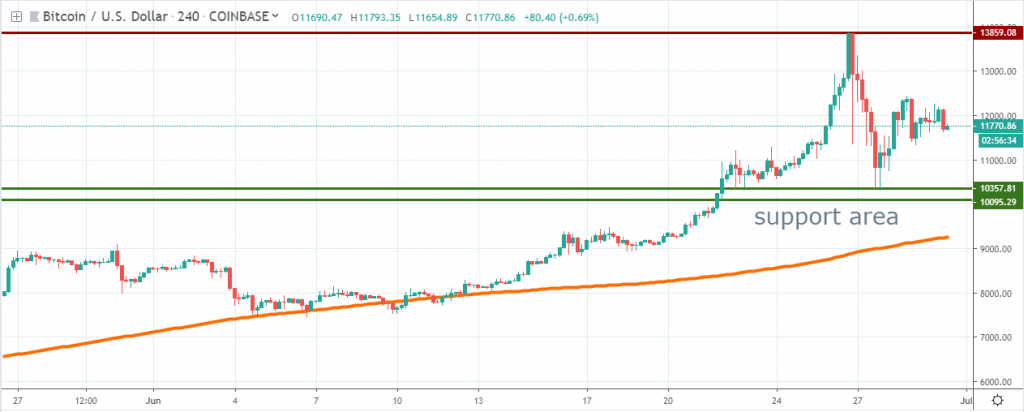
BTCUSD Coinbase
Source: tradingview.com
Bitcoin continued to march higher, above the $10,000 key resistance area and managed to a new 2019 high around $13.860. However, on June 26th it started to retrace impulsively, with around 30% of the value wiped out by 6 consecutive 4h chart candles. It is the most aggressive drop since February and it could signal that the bullish trend had become highly unstable.
In terms of resistance, we suspect the current 2019 high should cap the upside and in case buyers will push the price above, $15,000 is the next area to watch.
However, given the impulsiveness of the retracement, we want to switch to a slightly bearish bias and for the following week we think Bitcoin sellers could resume and retest the support area formed by $10,350 and $10,100. Below that, we have the 4h chart 200 moving average, which could keep the downside limited, in case the support area will fade.
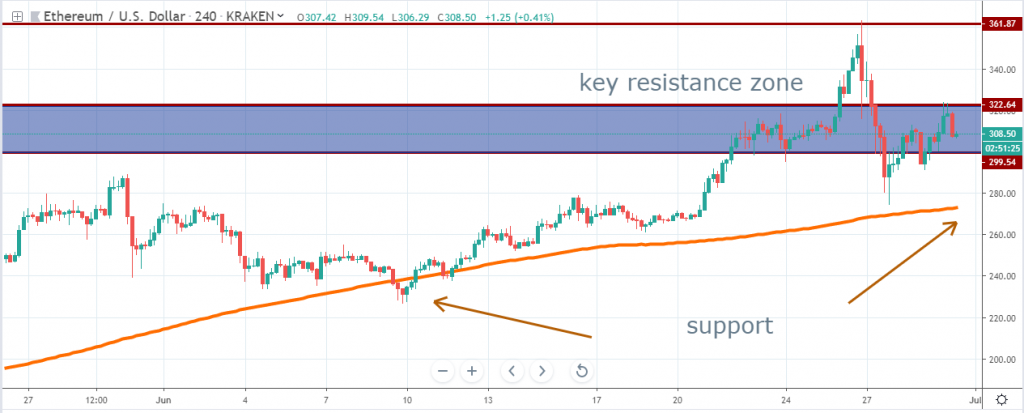
ETHUSD Kraken
Source: tradingview.com
Ether managed to break above our $300-$322 key resistance area and started to retrace exactly where we have expected – around the $361 level. Same as Bitcoin, the impulsiveness of the retracement had been strong, and drove the price action back below the resistance area.
At the time of writing, we can see the sellers reacted to the upper line of the area and it could signal that a false break setup is about to unfold. If selling pressure will intensify, we suspect Ether will head lower, towards the area located around the 4h chart 200 moving average, which had provided support several times in the past few weeks.
On a breakout above our key resistance, we should expect buyers to push the price towards $361, but at the present time, that looks like the less likely scenario, given how strong the retracement had been.
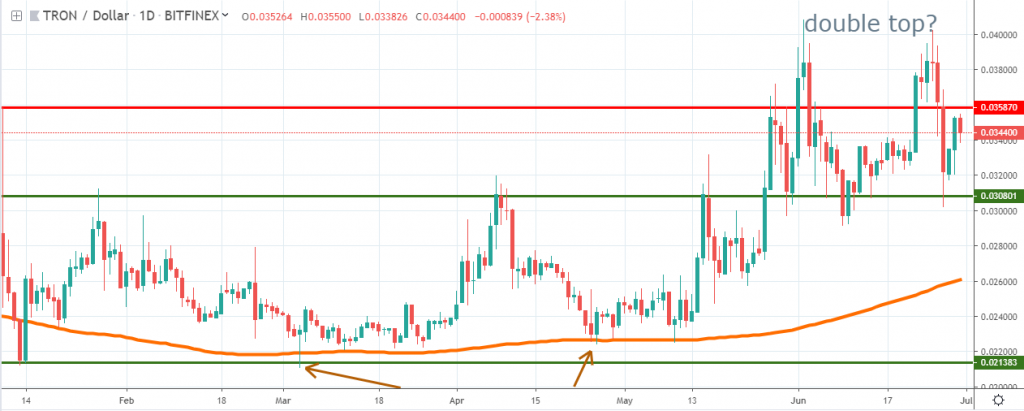
TRXUSD Bitfinex
Source: tradingview.com
For the entire month of June, Tron had been a laggard, moving back and forth around the 3.58 cents key resistance level. Since mid-January, the token price managed to break and remain above the daily 200 moving average, an encouraging sign for buyers, but at the present time, the picture begins to change.
A potential double top formation could be under development and if the sellers will manage to break impulsively below 3.08 cents, that could be an indication for further pain. In that case, we think a retest of the 200 MA looks like the most likely scenario.
If the buyers will manage to push Tron above the current 2019 high, the double top formation will be negated and we could see the price edging towards the 4.5 or 5 cents area in the following weeks.
Briefings about ICOs
On July 1st, Ellcrys will start its ICO in an attempt to offer a decentralized git hosting system that enables developers to store and share codes that cannot be censored or abruptly destroyed + an ownership lawyer that allows thousands of people to share ownership of software applications.
Nodis will end its ICO on July 6th and people are still able to get involved in a project that helps local businesses to get noticed online, increase traffic in store, and differentiate from competition.


There are no comments at the moment, do you want to add one?
Write a comment