
BTCUSD Coinbase
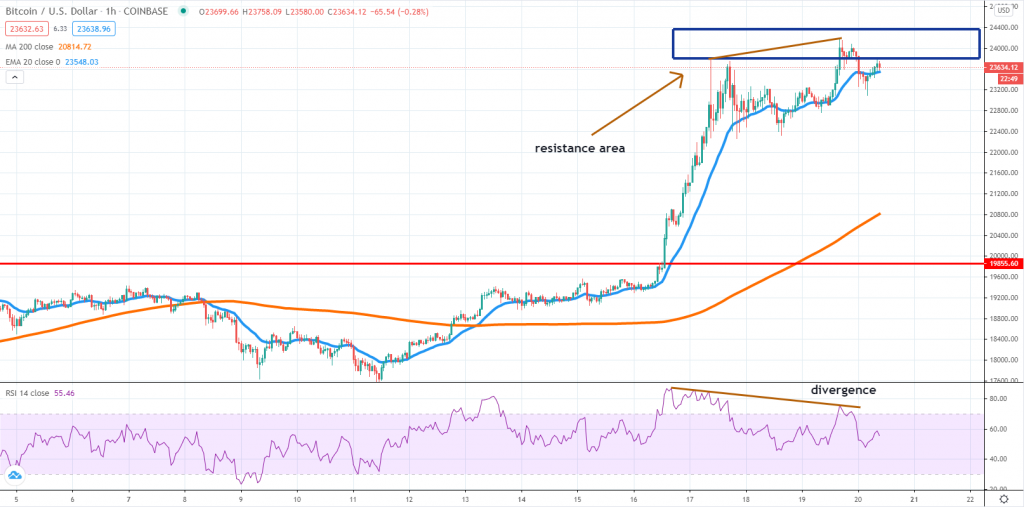
Once it broke above the 2017 high, there was no turning back for Bitcoin, which had reached a level above $24,000 recently. This is an important milestone for the top cryptocurrency but at the same time, as we’re about to see, it could signal that a corrective structure becomes increasingly probable.
According to the chart above, there is a divergence between the price and the RSI, as we see higher highs, while the oscillator posted lower lows. Usually speaking, that’s an early indication for a market turn and it could happen during the next few days.
The key resistance area highlighted on the chart should cap the upside. If buyers continue to push the price above it, then $25,000 will be the next major area to watch. In case weakness will start to build, we suspect the price will break below the 1h chart 20 EMA and head towards the $21,000 area. A retest of the 2017 high should not be excluded, but at that point buyers should step back in.
ETHUSD Kraken
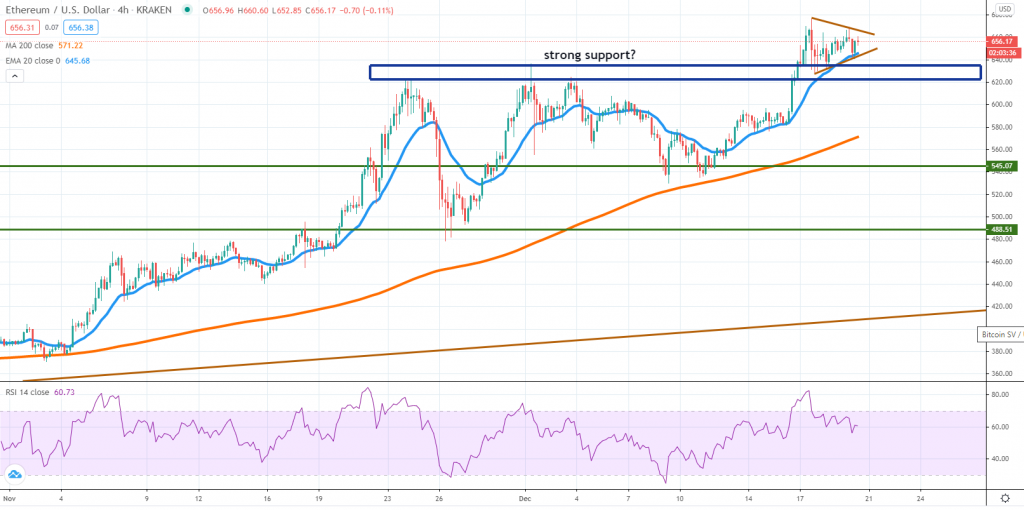
During the past week Ether managed to break above the December 1st high and since then consolidated above it. There seems to be a triangle formation in play and the direction of the breakout will very likely determine where the price action is headed.
Breaking above the key area highlighted on the chart is an important technical development for buyers, even though some short-term selling might emerge. As long as buyers manage to defend it, we think there’s more upside potential towards $680 – $700.
A breakout below the highlighted support zone will be a setback for buyers and will put sellers in control. In that case, it should be no surprise if the price goes back to retest the 4h chart 200 SMA. Keep in mind that our longer-term view continues to be bullish, but we must also admit that price cannot go higher indefinitely.
ADAUSD Binance
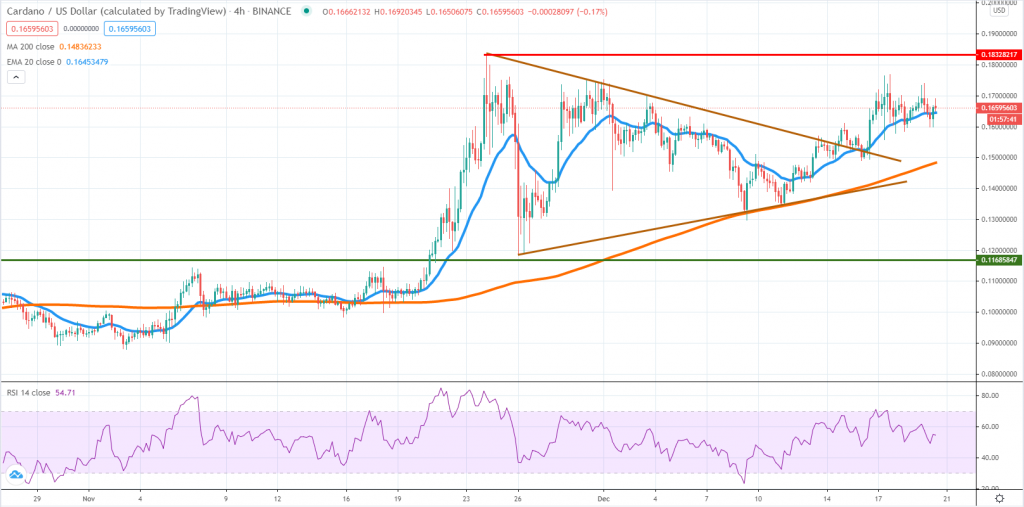
Cardano broke above a triangle formation and that was a good technical development for buyers. The price action is trending nicely above the 4h chart 20 EMA, but we should mention the momentum is rather weak.
Even though the structure was broken on the upside, the buyers don’t seem eager to jump into the market and that should be an early warning sign. In case the gains will continue into the new week, the $18.3 cents is the next resistance level to watch. A break above it could mean Cardano might retest the 20 cents area during the next few weeks.
Weakness driving the price below the EMA will be bad news and the 200 SMA will follow next in line. Only if the price breaks below we could say that sentiment shifted towards the sell-side. For now, buyers are managing to hold, but there could be more activity until the Christmas holiday kicks in and daily ranges will be smaller.


There are no comments at the moment, do you want to add one?
Write a comment