
BTCUSD (Coinbase)
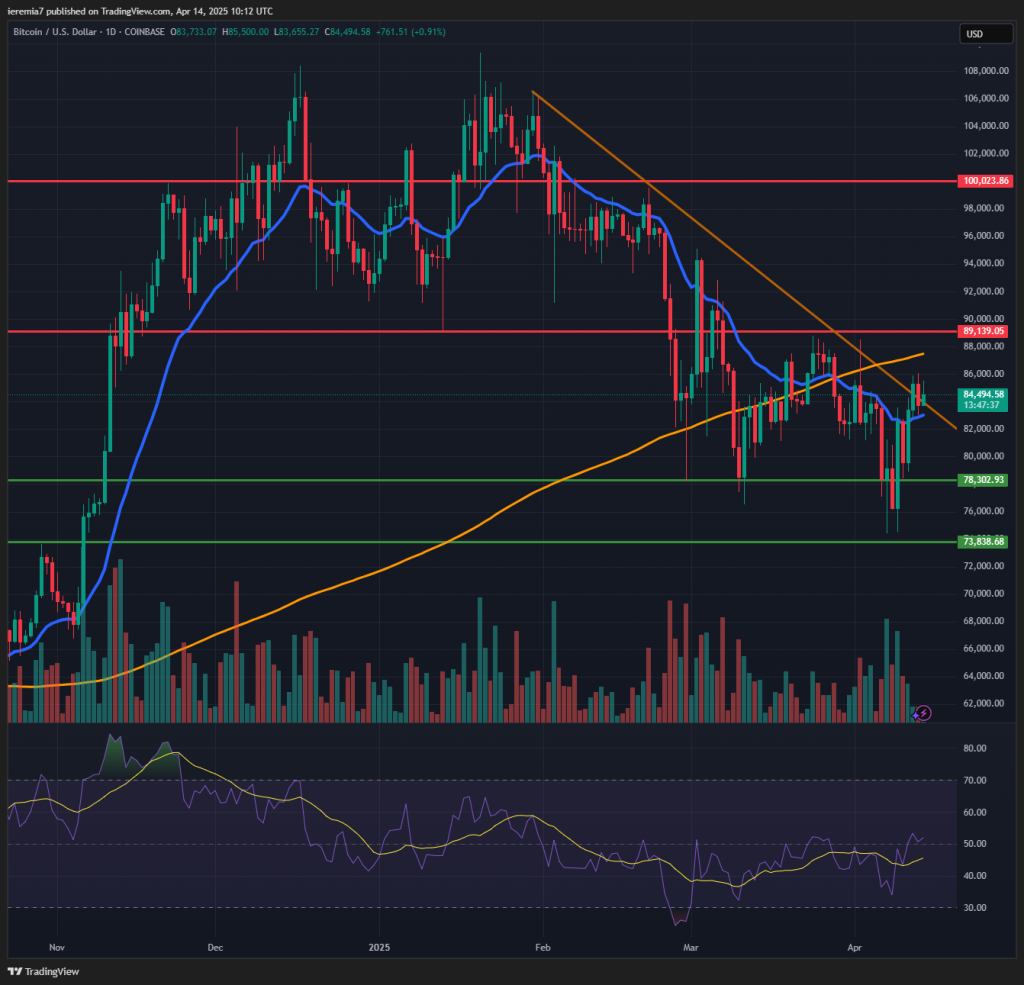
The market mood improved a few days ago after the US trimmed down tariffs and announced a 90-day pause for negotiations. Bitcoin reacted positively in tandem with major stock markets, finding support close to that $73,800 key area, which is a prior all-time high.
At the time of writing, BTC is attempting a break above a short-term bearish trend. The price action is choppy and we should also mention the daily 200 SMA is above, not below. Still, given that at the end of this week, there’s the Easter holiday, volatility should be able to contract.
Barring any new major negative headlines, Bitcoin can continue to edge up into the 200 SMA + the $89,000 key resistance. We need to break and hold above that to consider a further expansion of the current leg. Risks have abated in the short term, but uncertainty is still in the air.
Risk aversion can return anytime and if it happens, the first support area is $78,000, followed by $73,000. We are a bit worried because the market failed to retest the prior ATH. If the sentiment slumps again, it’s possible for BTC to break well below that.
ETHUSD (Kraken)
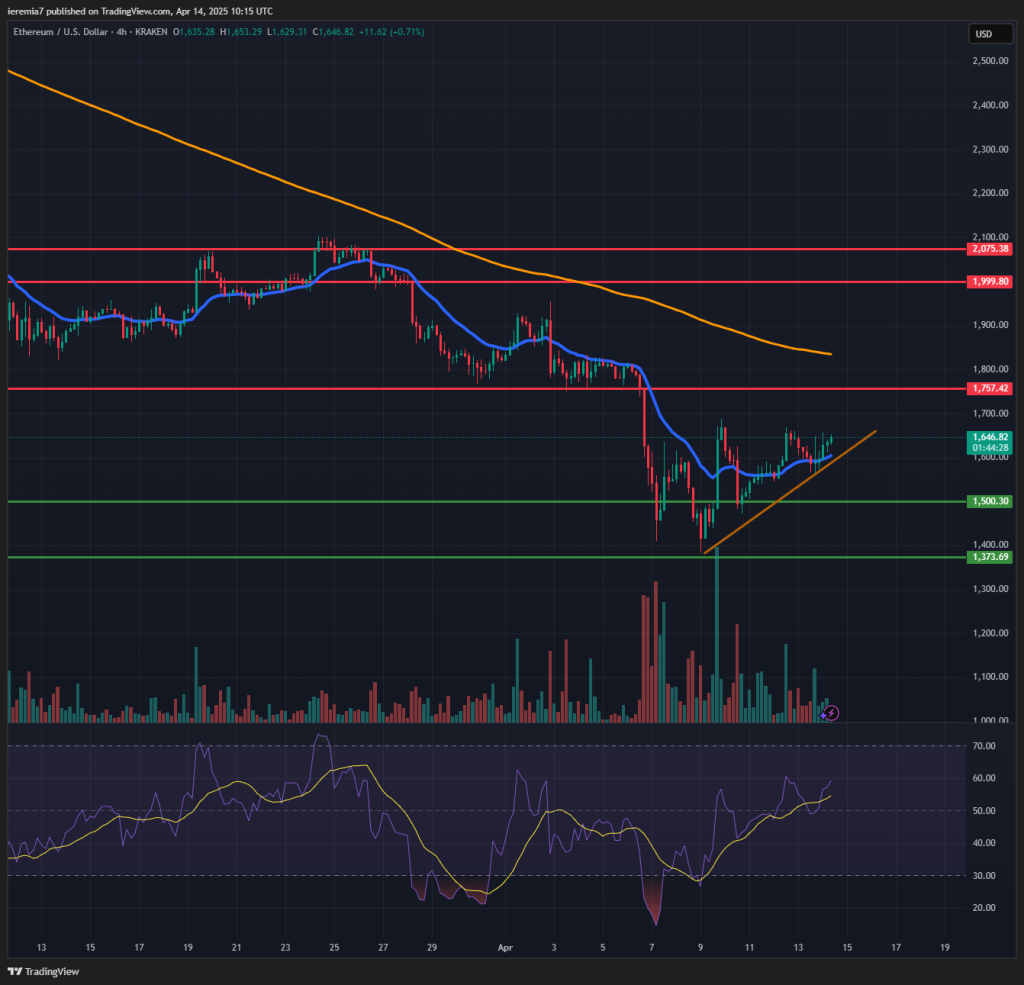
Ether is also recovering, posting higher lows and higher highs. Looking at the 4h chart, the price action is treating the 20 EMA as support instead of resistance and the RSI is edging towards the overbought zone.
We think there is room for upside and the first resistance to watch is $1,750. Above that, buyers need to break the 200 SMA in order to technically shift the sentiment in their favor. As liquidity thins out heading into the holidays, we advise traders to trim exposure since some moves could get wild.
As long as the price keeps trading above the trend line posted on our chart, then the short-term bullish sentiment remains in play. Breaking below it could mean a resumption of stronger selling and $1,500 will once again become the key support ot watch.
LINKUSD (Kraken)
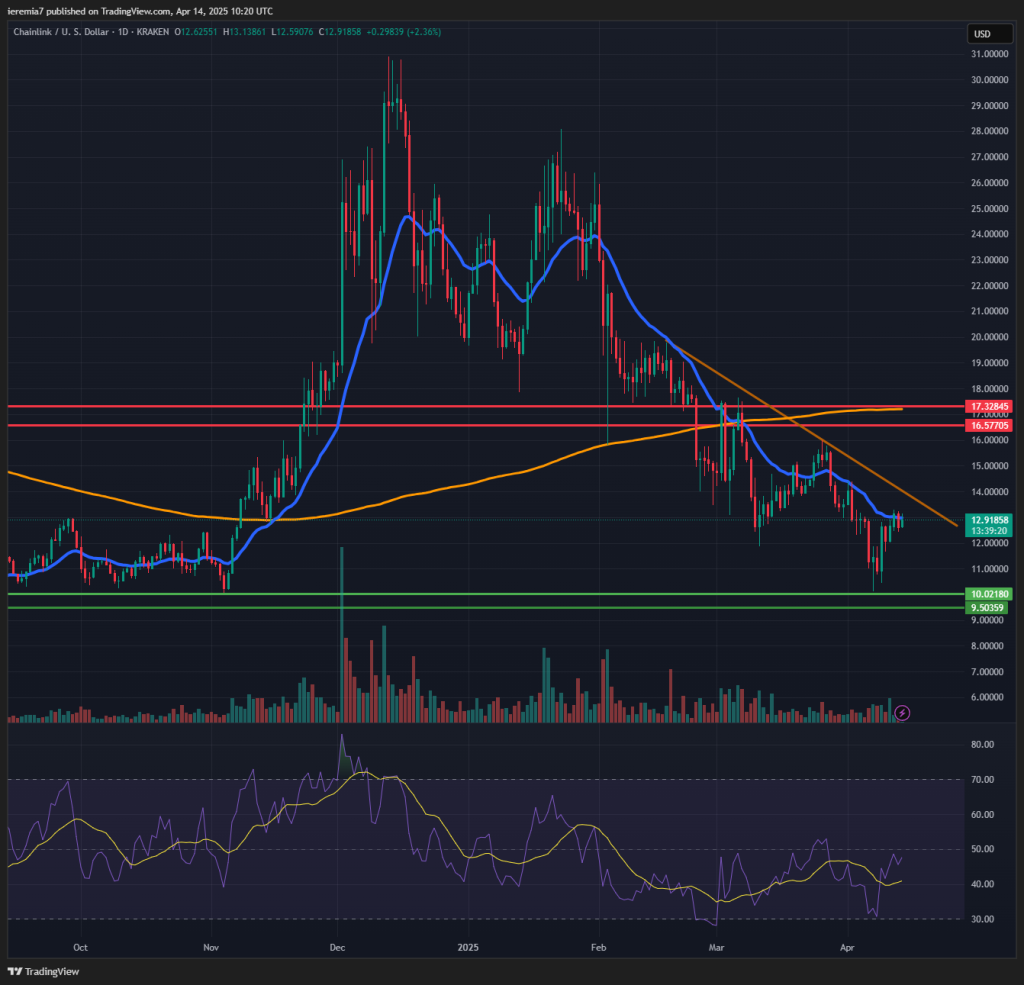
Chainlink found support close to the $10 key psychological area. We are now seeing the price attempting a breakout above the daily 20 EMA, a dynamic resistance zone where sellers stepped in several times.
We view the $12 area as a swing point and support in case selling resumes. Below that, attention should shift below to $10 – $9.5. The price has been in a downtrend since December 2024, but that doesn’t mean a move higher can’t materialize. In fact, we believe it’s possible to see LINK staging a rally into $16.5 – $17 before starting to weaken again.
Until then, buyers need to clear the 20 EMA and the bearish trend line on our chart. Once that happens, the market should be well positioned for an extension into the daily 200 SMA. Oversold conditions and attractive valuations are supportive of that. We will shift to a bullish stance only if LINK manages to break above $20.


There are no comments at the moment, do you want to add one?
Write a comment