BTCUSD (Coinbase)

Source: tradingview.com
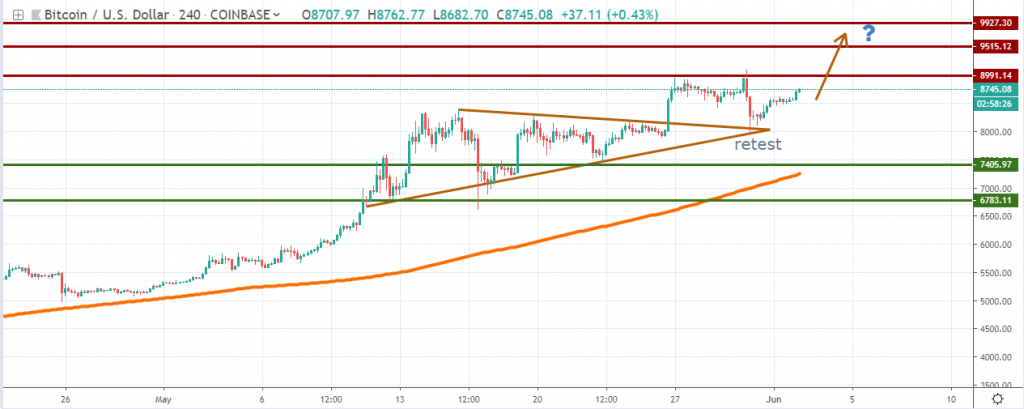
The triangle pattern we’ve talked about in our last weekly crypto analysis had been broken on the upside, which led Bitcoin to head towards the key $9,000 area. As we have anticipated, stronger selling emerged there with the token losing $1,000 from its value in less than 8 hours.
However, the market retested the broker pattern and is back on its way up, most likely being able to retest the $9,000 area very shortly. This is a sign of bullish strength and we could witness a new bullish breakout. Above the resistance, $9,500 and $10,000 are the most likely targets for Bitcoin, as the impressive bull run continues.
We should also not exclude the possibility of a double top formation happening around $9,000. If that scenario will materialize, Bitcoin could edge lower towards $6,500 in the next few weeks, but we need to see much stronger selling pressure in order to have a clue that will happen.
ETHUSD (Kraken)

Source: tradingview.com
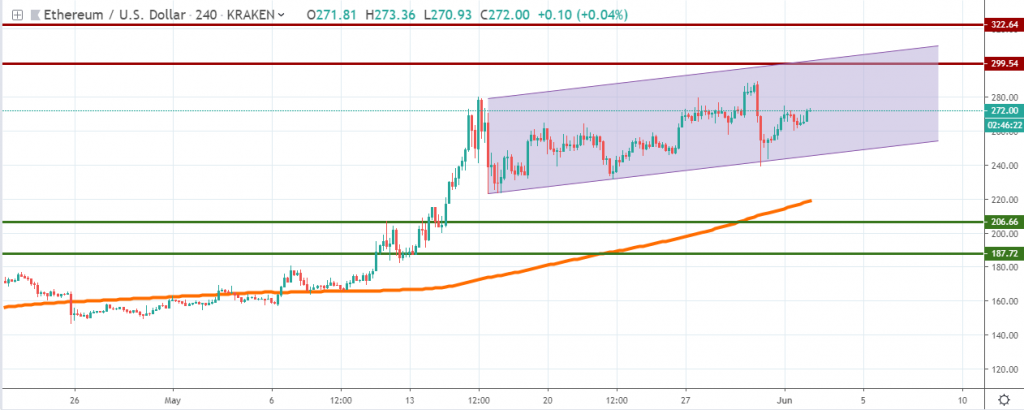
Ether managed to generate a new 2019 high before starting to sell lower, in line with the Bitcoin weakness. However, the price continues to advance higher in a nice ascending channel, with the most likely target located around the psychological $300 area. Above it, $322 follows next and our take is that stronger selling will emerge around it.
As long as we see the string of higher lows and higher highs continuing, Ether will continue to advance higher. A breakout below the channel will be a negative sign for the bulls as the momentum will be weakening. Ether could retest the 4h chart 200 moving average if that will materialize. Still, right now the order flow is biased towards the buy side and there could be some juice left into the bullish trend.
XRPUSD (Bitfinex)

Source: tradingview.com
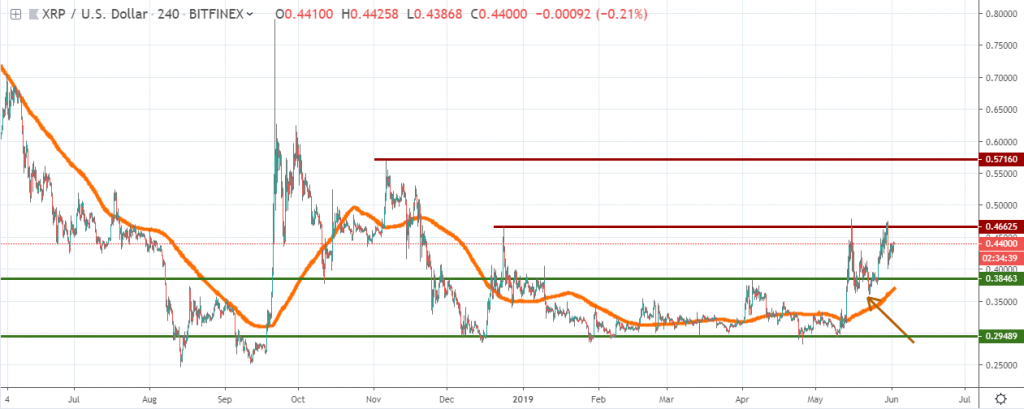
XRP had been one of the biggest large-cap underperformers in 2019, but things began to change since May 8th. The buyers managed to defend successfully the 29.48 cents support area and now the token is back on its way up.
Looking at the greater picture, XRP seems to be forming a nice bottoming formation that could lead the price towards the 80 cents in the next few months. In the near term, however, the 46.62 cents and the 57.16 cents resistance area should be watched for further clues.
On the downside, buyers could get long on a retracement towards the 38.46 cents support area, where the 4h chart 200 moving average is also located. So far, the 46.62 cents managed to cap the bullish momentum, but if buyers will continue to pressure it, we could witness a breakout in a matter of days.
Briefings about ICOs
TreeBlock is an active ICO which will end on June 7th, wanting to create a high performance and unstoppable IoT Blockchain Network for general purpose application. It combines Hierarchy Shading and Time Shading Trees architecture able to scale blockchain.
On June 18th, XR Web will start its ICO, as a pioneer in the development of the spatial / XR web 3.0 with a decentralized framework to build applications that are meant for the physical spatial world around us and incorporate AR/VR technologies.


There are no comments at the moment, do you want to add one?
Write a comment