
Bitcoin
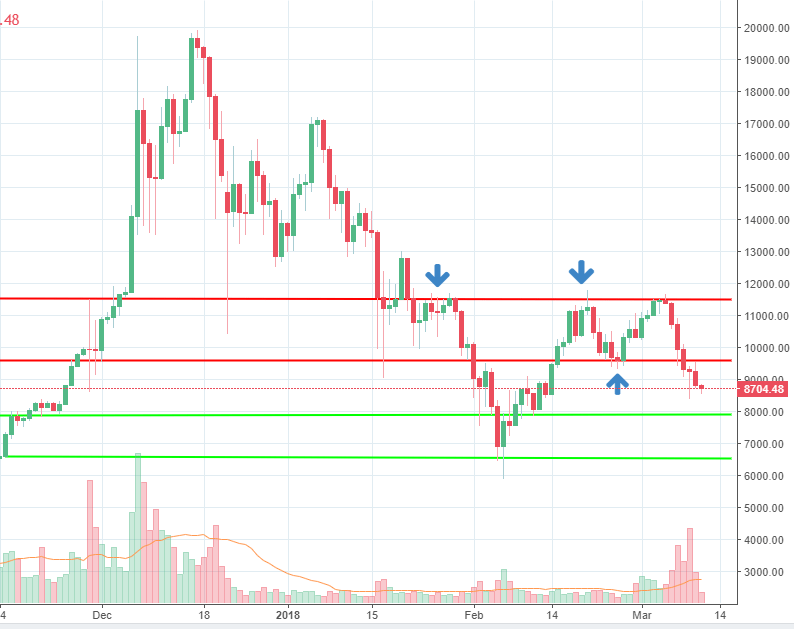
The last week had been negative for Bitcoin which had dropped by more than 20%. Our key resistance area located around 11,500 held for the third time and a new aggressive selling wave had started from that point. Looking at the entire leg, we can see six red daily candles in a row, which mean sellers had been active the entire week. Today being Sunday, the activity is weaker, but considering there had been such a strong appetite for selling the entire week, the move could continue further.
Our first support area is located around the 8,000 figure, being followed by 6,500. We expect buyers to emerge around those two levels since we can see buying activity there in the past.
On the other hand, sellers are expected to rejoin the trend, if the price action will reach 9,600 area. Above that zone, 11,500 should follow.
Source: dailyfx.com
Monero
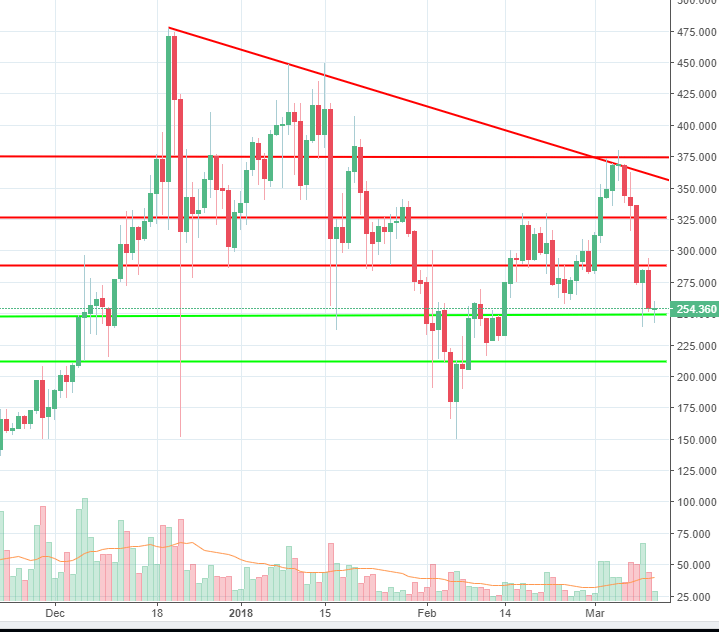
In our last crypto analysis, we’ve talked about Monero and a key resistance area formed by the 375 level and a descending trend line. As you can see from our chart, the price action had reached that zone and the buyers could barely drive the price above it. What followed is a strong selling wave that drove the price action to 254, the level where it is currently located. That means an approximately 30% drop in less than a week.
Looking ahead, given the impulsiveness of the move we expect it to continue to extend. Two of the most significant support areas are located around 250 and 210. We can already see bullish interest around the first one, but in case it will fade, 210 will follow.
On the other hand, if a retracement higher will take place, sellers could resume around 288, where they did yesterday. Above that level, 325 is another area where sellers are expected to rejoin the trend.
Source: dailyfx.com
Ripple
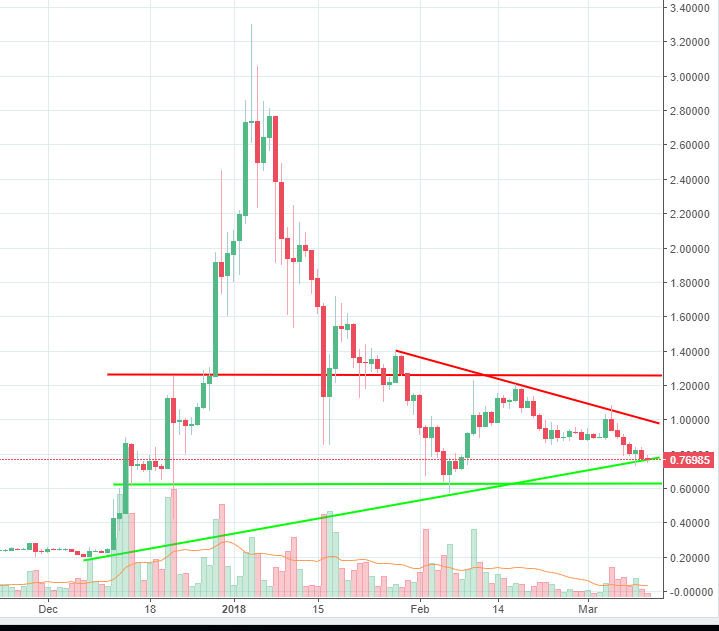
Ripple had also been under pressure for the last week and as you can see from our chart, it is trading inside a triangle formation. At the time of writing the price action is located around the bottom line, with little reaction from the bulls. Due to that fact, a breach below the line could be possible, but the 0.62 key support area will follow then. There are some strong rejections off that level in the past that is why we expect the buyers to respond aggressively if the price will reach that point.
In case it will continue to trade inside the triangle pattern, we expect a new leg up towards the top line. In case a break on the upside will take place, we expect the price to continue to advance towards 1.25 resistance level, where sellers could be waiting to get short again.
Source: dailyfx.com


There are no comments at the moment, do you want to add one?
Write a comment