BTCUSD (Coinbase)
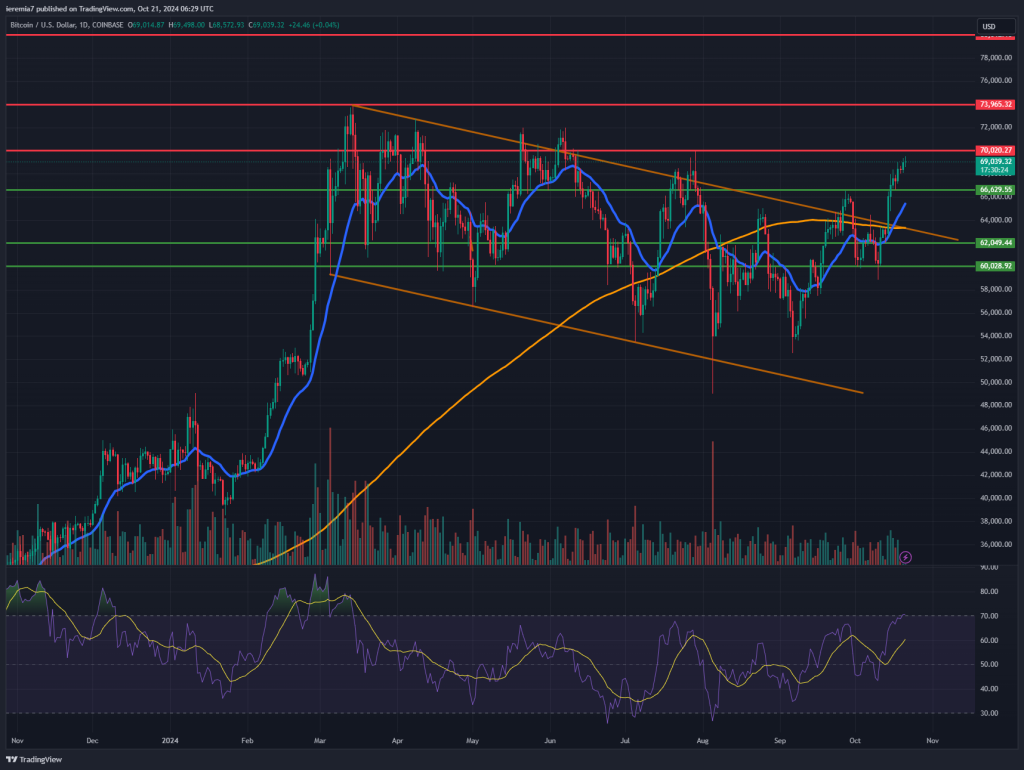
We were right last week in assuming that the Bitcoin breakout would finally occur and lead to more gains. As the chart shows, the price is close to the resistance level we mentioned—$70k. Although some temporary selling should be expected there, we believe the breakout is a key technical development that will keep incentivizing buyers to enter on dips.
As a result, the $66.6k area is now a role reversal level and support. The daily 20 EMA is not too far below it, so should offer support as well. The RSI on the daily chart is around 70, but buyers shouldn’t be afraid of this. We’ve seen the indicator trading above 70 for weeks.
Things point to a continuation toward the $74k area, or a little above the ATH. Breaking above will open more room towards $80k, the next psychological level to watch. Our bullish stance will be negated only if BTC breaks and holds below the trend line + daily 200 SMA.
That’s the low-probability scenario at this point since we are in a bullish period from a seasonal standpoint. This is another reason further reinforcing a continuation higher.
ETHUSD (Kraken)
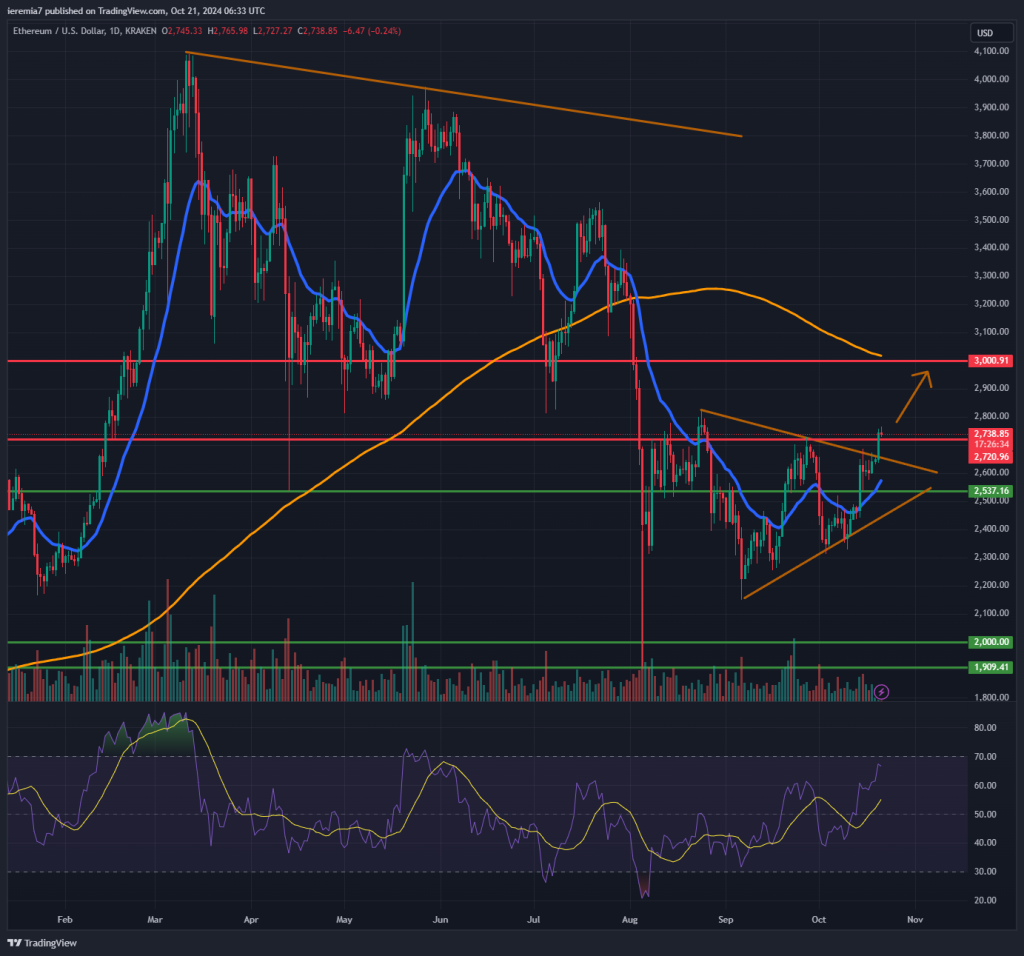
Bullish developments can be spotted on ETH as well since the market broke above the triangle formation. RSI is not overbought yet, which gives buyers more space to handle. We did expect a temporary pause around $2.7k and as the chart shows, the market is currently unable to advance further.
That doesn’t mean the move up has ended. In fact, we think dips towards $2.6k will be bought by buyers waiting to enter at more affordable levels. Right now, our upside target has shifted to $3k, where the daily 200 SMA is also located.
As long as BTC continues to perform well, that positive sentiment should spread out to Ether as well. Only if we see an impulsive break below $2,500 will we shift our view to a slightly bearish one. That’s not the case for the moment.
XRPUSD (Kraken)
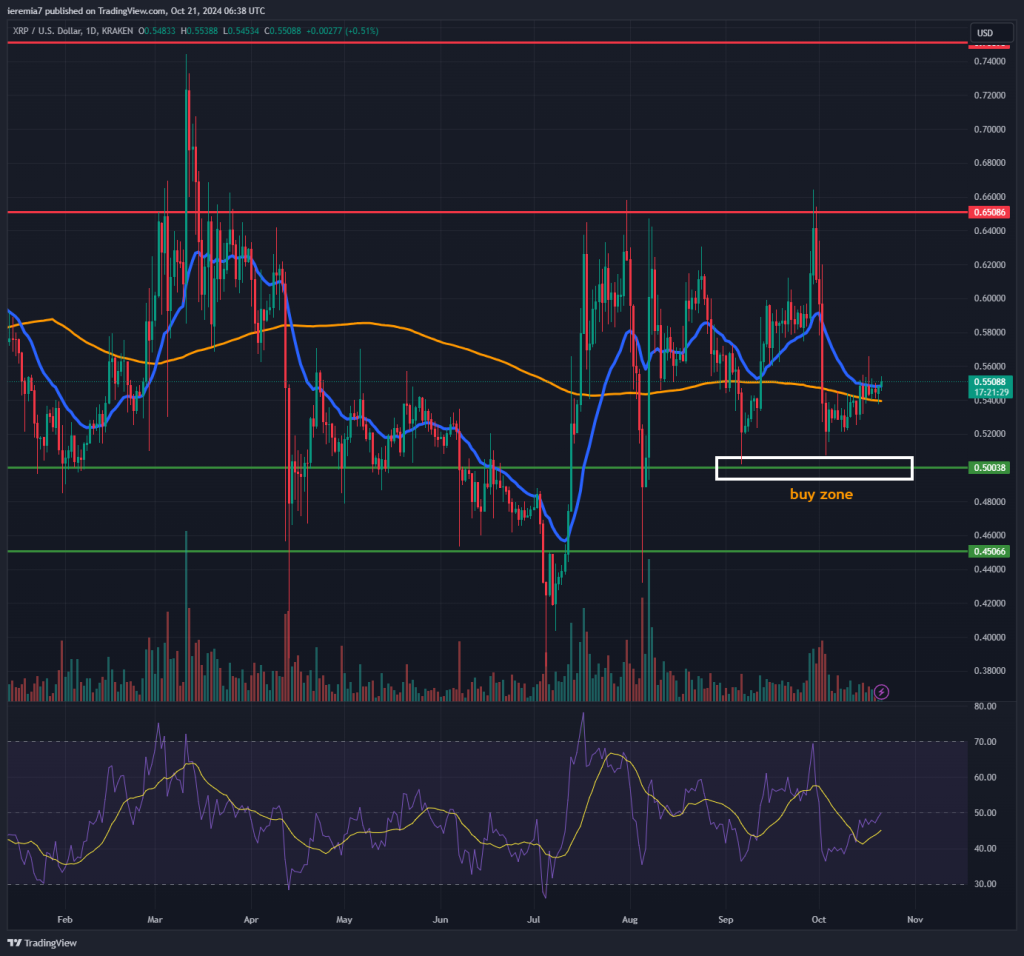
XRP continues to trade inside a range between 65 cents and 50 cents. That has been the case since July and led to multiple trade opportunities on both sides of the market. After a 3-day selloff, the coin stopped exactly at our buy zone and now the price action seems to show some buyers accumulating.
As a result, we think the coin could move up to the 64 cents resistance and if buying accelerates into that level, a breakout will be increasingly likely. Also, keep in mind that, when this range breaks, it could lead to an impulsive follow-up.
Basically, the market was constrained for months into trading inside a tight range. Once that zone is breached, a burst of volatility usually follows. Since buyers/sellers chase the breakout, it leads to a self-reinforcing pattern.
Our view has not changed and we are buyers at 50 cents and 45 cents, until the market breaks impulsively below. Things look good for the bulls right now.


There are no comments at the moment, do you want to add one?
Write a comment