
BTCUSD (Coinbase)
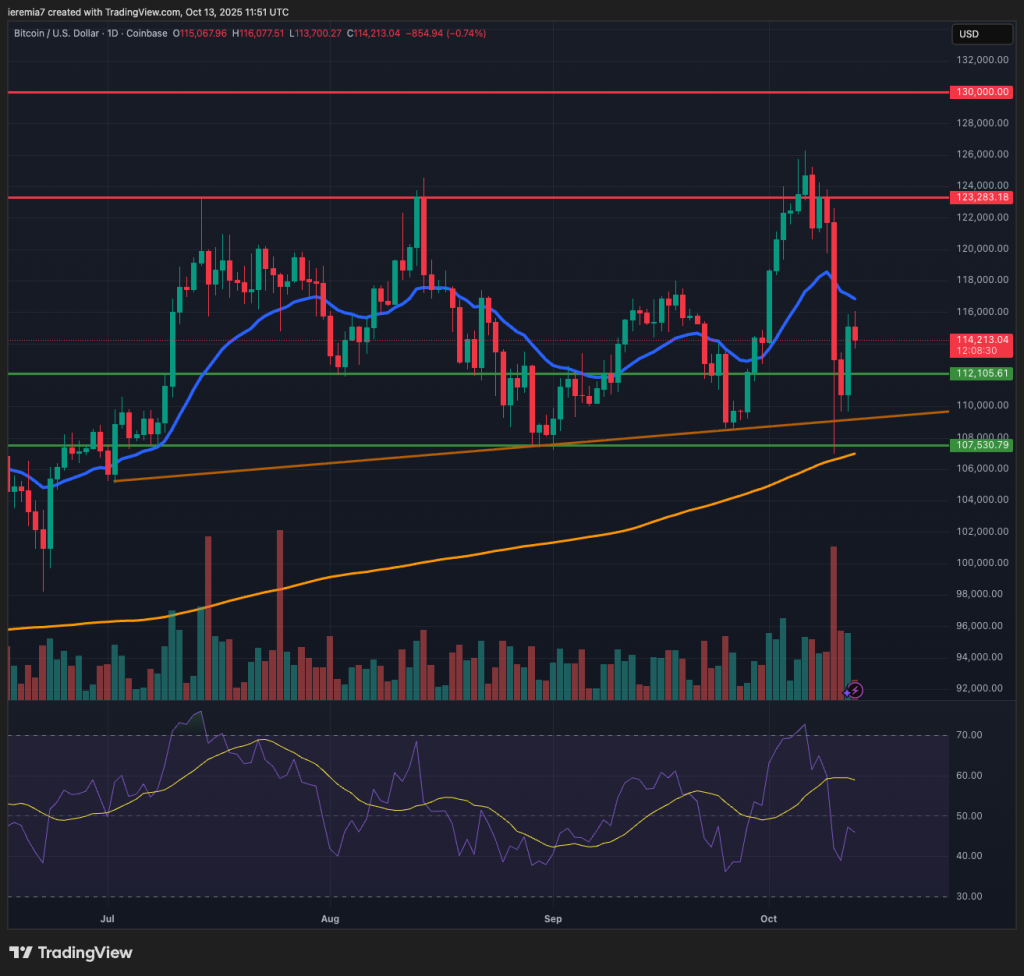
Bitcoin volatility spiked during the last few days on the back of renewed worries related to US – China trade. Although the price managed to reach a new ATH, it failed to build momentum. Selling was aggressive, but stalled close to the daily 200 SMA, an important area we are regularly highlighting.
This was a liquidation and usually, the price manages to bottom out and recover. A bounce has already taken place, but the key question is whether the uncertainty has fully vanished and we don’t think that’s the case right now.
In terms of technicals, we won’t shift to a bearish stance until BTC breaks and holds below the daily 200 SMA. Since it didn’t do that, we expect the price to retest the daily 20 EMA and maybe even the $118k area if buying improves this week.
That’s a key area to overcome and only above it we’ll expect further gains towards $123k. We advise caution since the market is vulnerable in the face of major trade-related headlines. At this point, committing to a specific side of the market is not suitable.
ETHUSD (Kraken)
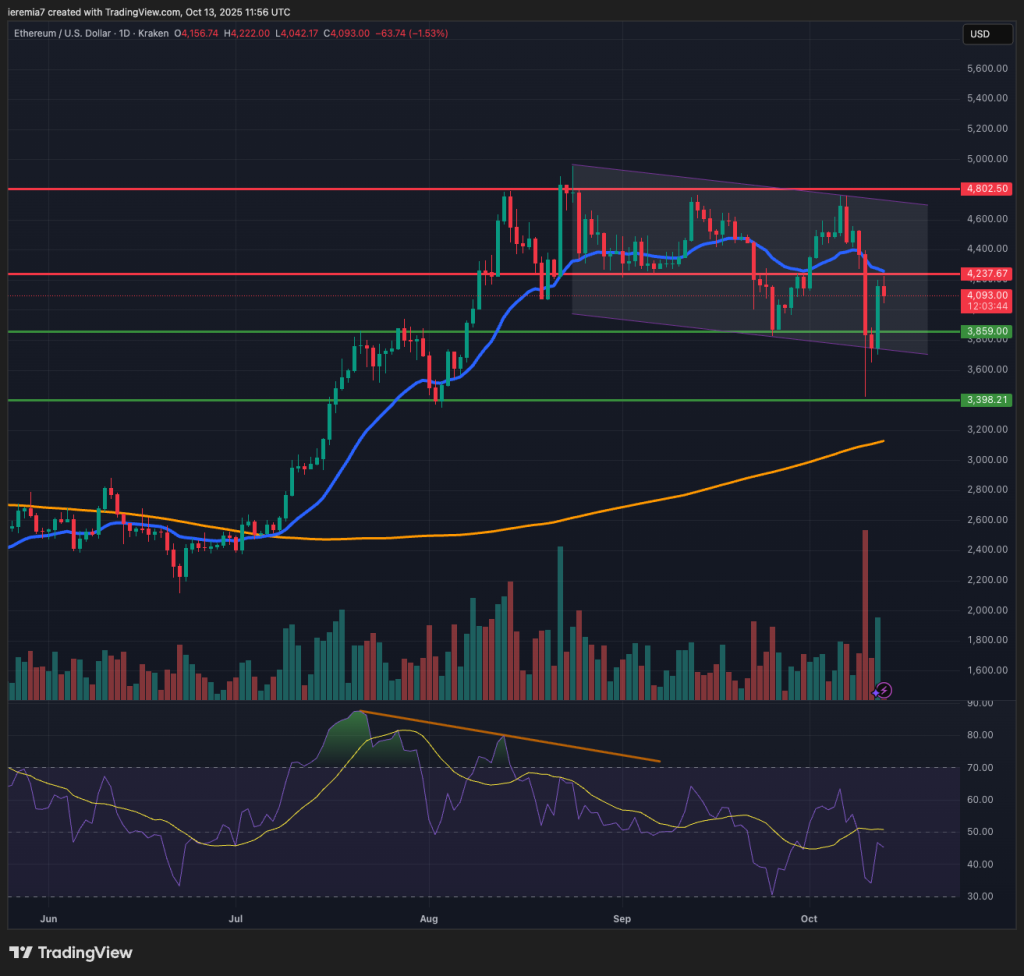
Altcoins were under larger pressure and Ether has not been spared, considering it dropped 28% from the October 6th high. The market has been consolidating lower since the end of August and based on current developments, we are not confident buyers have resumed in full force.
Same as with BTC, the selloff does look like an exhaustion, so if the downside is contained this week, we might be looking at more gains towards the end of October. Resistance comes at $4,250 and the daily 20 EMA, followed by $4,800.
The first major support is located at $3,850 and the bottom of the parallel channel drawn on our chart. Despite some heavy selling short term, the broader picture still doesn’t suggest a trend reversal. That will be our view as long as we don’t see further downside below the October 10th low.
XRPUSD (Kraken)
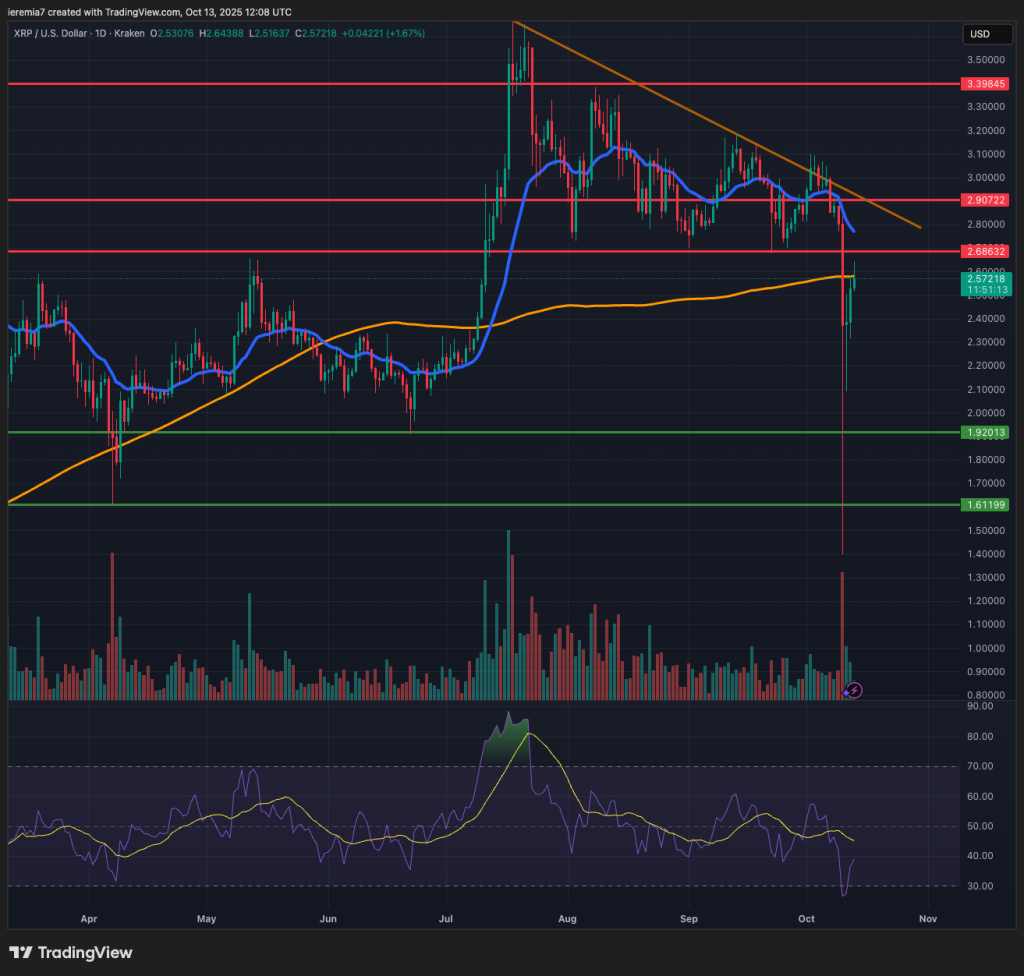
In XRP’s case, the selloff extended beyond 50%, a move that was common among most altcoins. You can see from the chart the large tail extending beyond 2 major support areas, confirming many traders got liquidated below those levels.
After the sharp drop, the market managed to recover two-thirds of the losses and it’s now struggling to exceed the daily 200 SMA. Even if a temporary pullback can happen from here, we think the recovery should continue, as long as trade tensions ease.
Above the current price, $2.68, the daily 20 EMA and a bearish trend line are key resistances to watch if buyers continue to lift the price. Below, we see support around $2.4 and if that doesn’t happen, we might need to see further selling towards $2.1 before stronger buyers kick in again.
Be aware that buying at this point will be very speculative. We expect volatile short-term moves on both sides of the market during the next 2-3 weeks.


There are no comments at the moment, do you want to add one?
Write a comment