BTCUSD (Bitstamp)

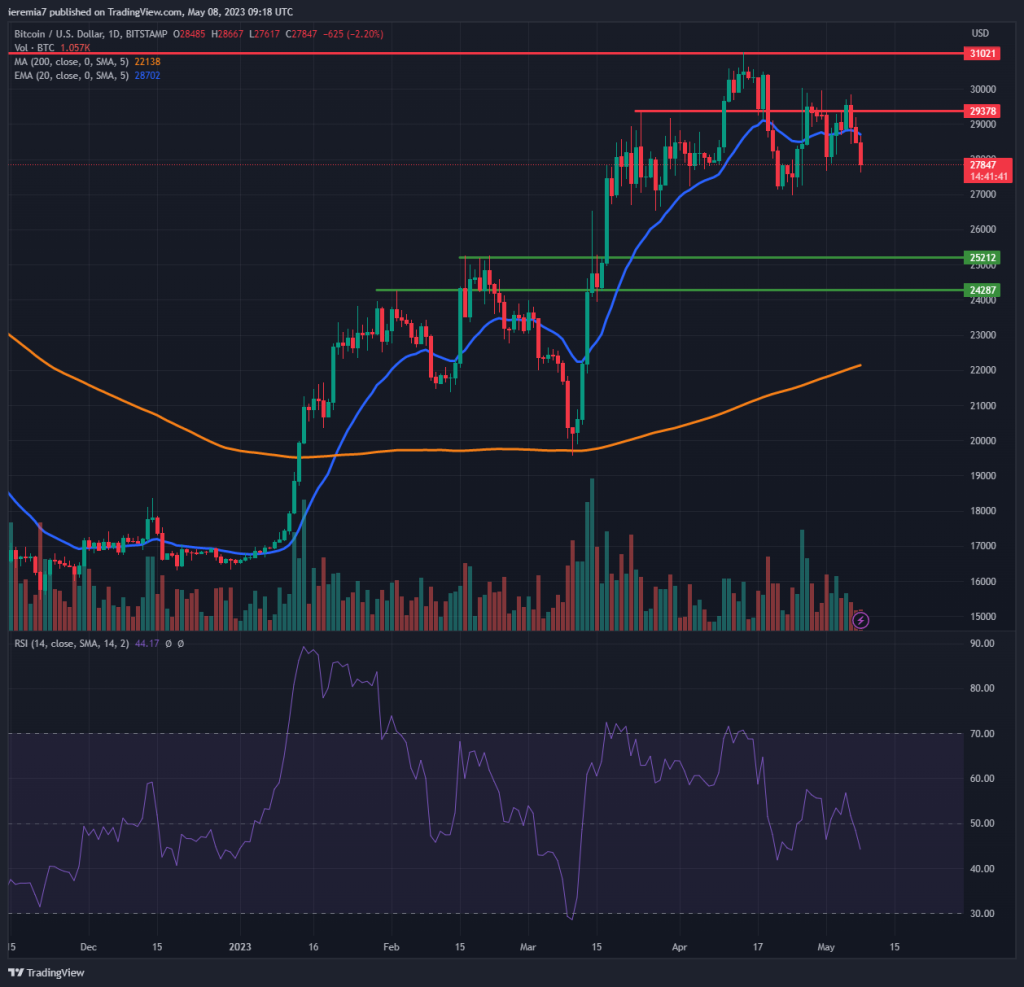
Bitcoin ended slightly negative last week and that sentiment seems to be extending, considering we see an inability to break above $30,000. As we’ve mentioned in the past, that’s an important line in the sand and as long as buyers can’t push BTC above it, more selling could prevail.
Based on our assessment, the probability of a continuation towards $25,000 has increased. There was a short-term panic during the weekend when Binance had to restrict BTC withdrawals due to network congestion, but even if that issue is now solved, we still can’t see an improvement in sentiment.
Little below $25k, we see $24.3k as another important support, so that area should be able to cap the downside. On the upside, our key resistance lines are $29.4k and then $30k. If the market breaks above them $31k would be the next target. If that will be the case, we believe there will be scope for more bullish interest and $35k will become the next area of interest. We would like to highlight that, at least for the time being, bears seem to be slightly favored.
ETHUSD (Kraken)

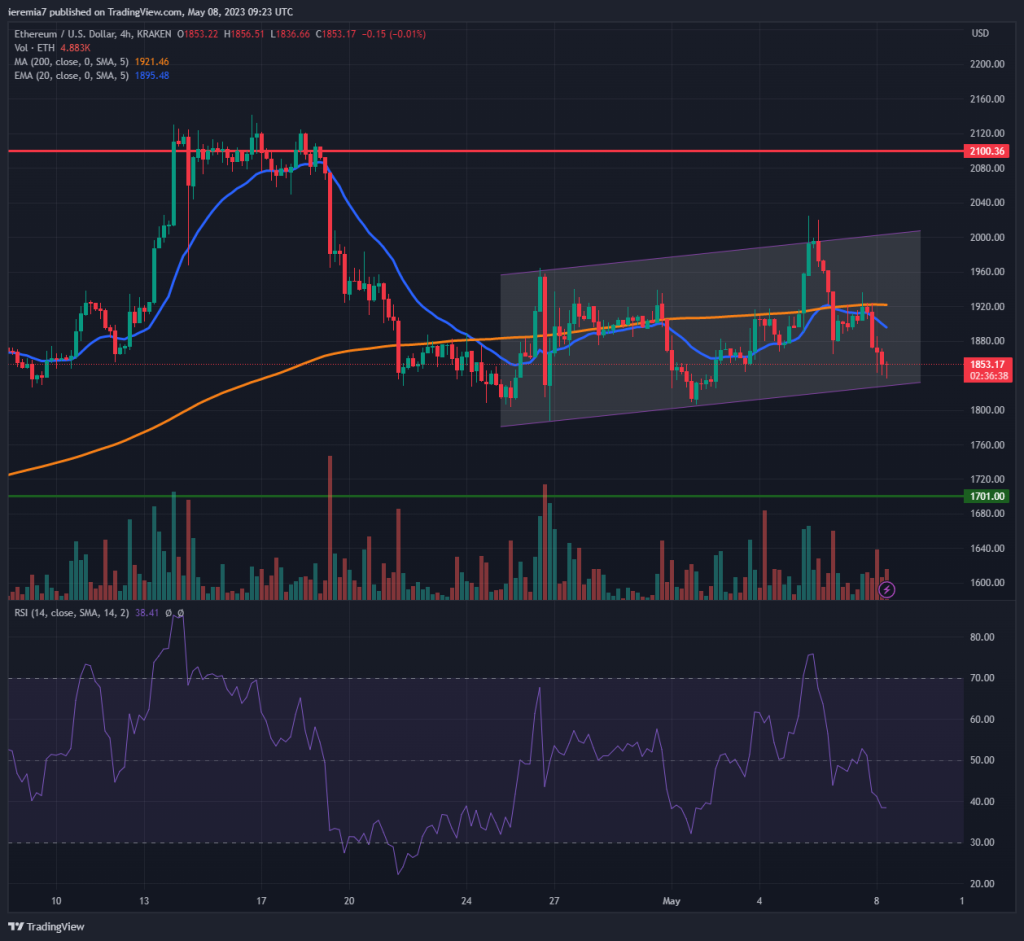
Ether had a choppy performance last week, but we see the price fluctuating inside a short-term ascending channel when looking at the 4h chart. Thus far, the market respected both sides of the structure, so as we get close to the bottom of it, a bounce should be expected.
In that case, it’s possible to see a new retest of $2,000, a key psychological area. Until then, ETH must break above the 4h 200 SMA. On the upside, we see $2,100 as an important resistance zone. Only a break and hold above it on the daily chart would be a clear sign of improved market sentiment, which will shift our target towards $2,200 -$2,300.
On the flip side, renewed selling pressure could mean Ether is poised for a retest of $1,700. That’s an important support area and a break below it will expose $1,500. Overall, as long as there isn’t any major news, we suspect ETH will continue to be range-bound between $2,100 and $1,700 for this week.
DOTUSD (Binance)

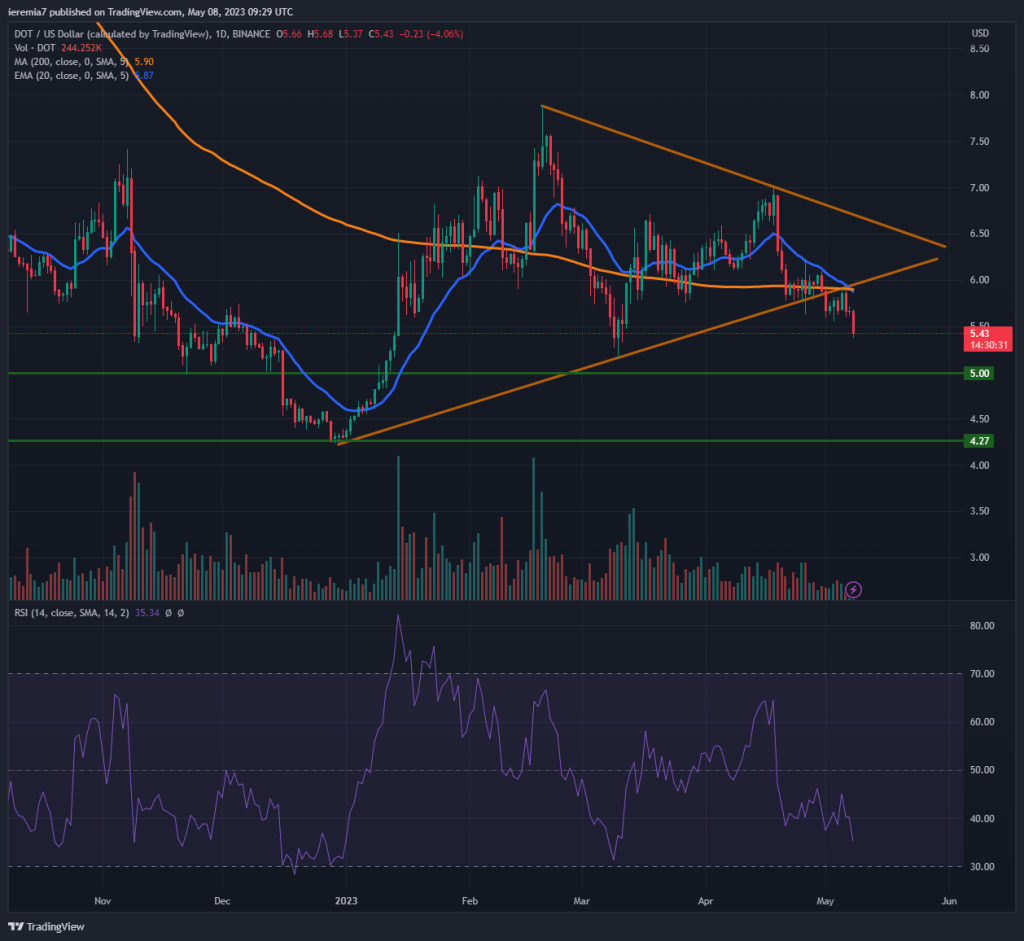
Polkadot is down 7% for the last 7 days and when looking at the chart, we can see that the price broke below a triangle pattern. The context is favorable for bears, considering we are now once again trading below the daily 200 SMA.
With that being the case, we expect further weakness during this week, and the next downside target to watch is $5. If the move accelerates, $4.2 will follow suit, which is where the market started an impulsive move up back in December 2022.
This isn’t the kind of setup to incentivize buyers. We believe there will be strong bullish momentum only after a break and hold above $6. That doesn’t look like the most likely scenario at this point, but we’re dealing with a crazy market, so anything can happen.


There are no comments at the moment, do you want to add one?
Write a comment