
BTCUSD (Coinbase)
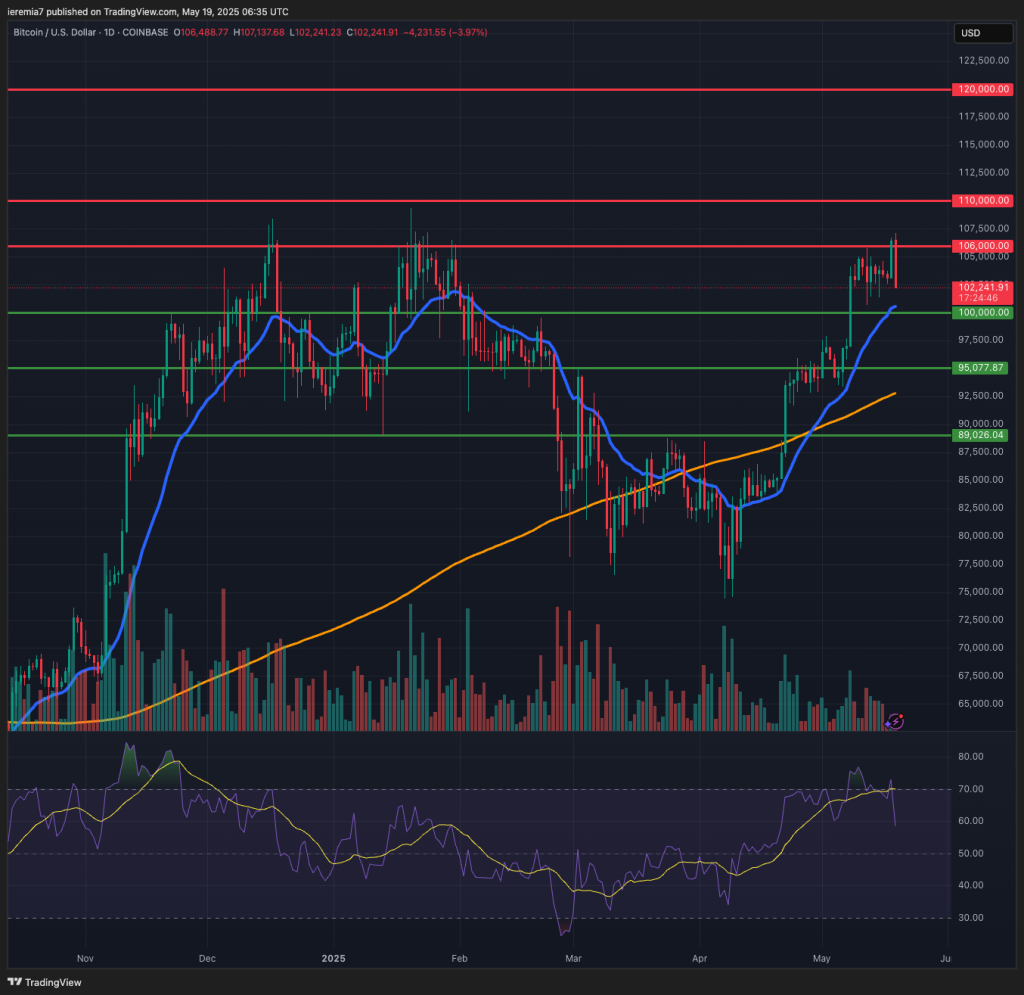
Bitcoin consolidated at a higher ground last week, but today’s price action shows sellers are starting to gain traction. Resistance emerged at $106k, an area we flagged in our previous weekly crypto analysis. There’s an engulfing bar on the daily chart, suggesting strong offers and for that matter, we expect the 20 EMA to be retested.
Luckily for bulls, that’s also where the $100k area currently overlaps, which further reinforces the support zone. But, it all depends on whether sellers will be absorbed. Further selling below $100k will open more room towards $95k – daily 200 SMA. That looks like stronger support and it will be more attractive for bulls to rejoin the trend.
All financial markets might be a bit ahead of themselves since geopolitical risks have not dissipated completely. We are just witnessing a pause and uncertainty should start picking up again soon. That might be the reason why Bitcoin failed to make a new ATH. Buyers need to overcome $106k and then we’ll shift to $110k and $120k. We don’t expect everything to fall apart this week, but some weakness after an impulsive move higher might be on the cards.
ETHUSD (Kraken)
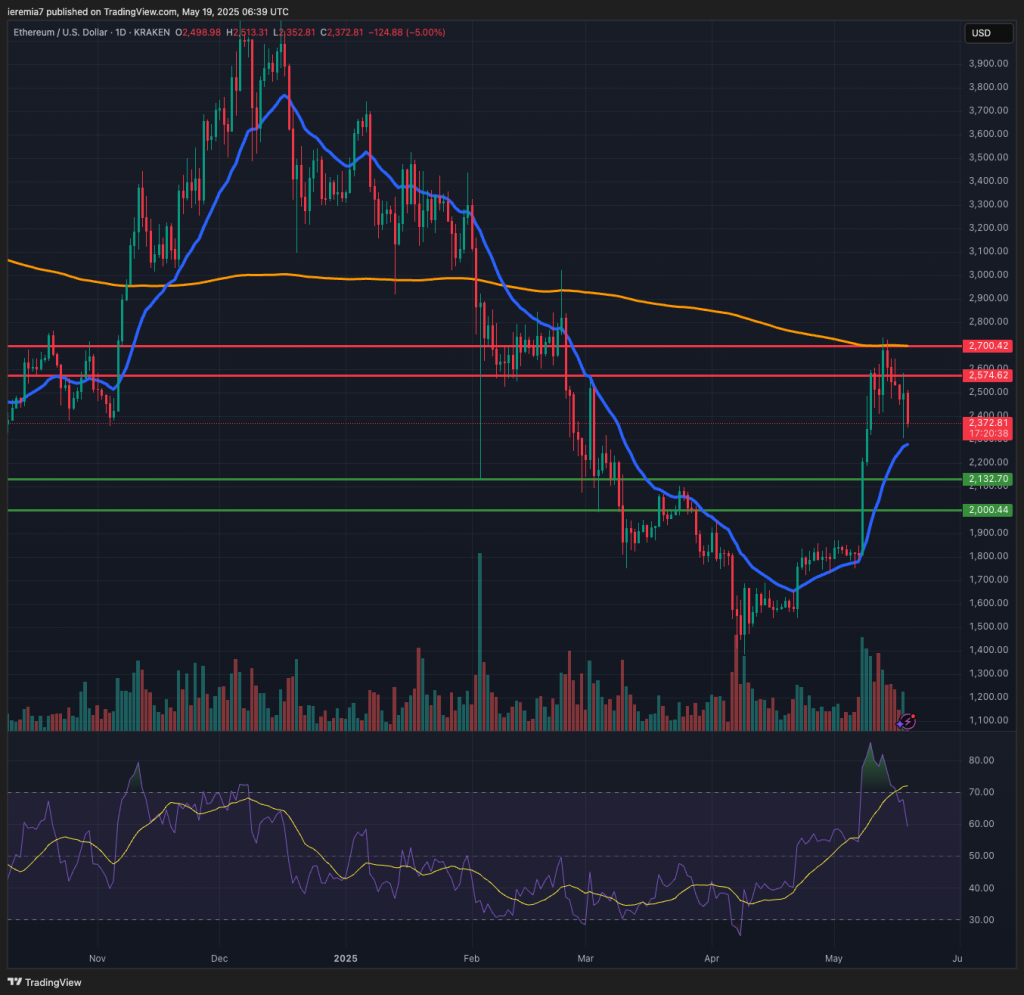
Ether outperforming BTC was a nice development for traders focused on the altcoins space, but here again, we see how the bullish sentiment stalled. ETH surged into the $2,700 + daily 200 SMA resistance zone and found enough offers to turn south.
At the time of writing, the price looks poised to retest the daily 20 EMA, something normal during a healthy bullish trend. The key will be to see if buyers manage to turn the tide around that zone. We expect $2,130 and $2,000 to act as support as well, in case the price dips below the blue line.
As long as there are no new major headlines to impact the price negatively, we believe that should be a floor for this week. Also, on the upside, $2,500 and $2,700 act as a ceiling for the range. Traders should find plenty of short-term opportunities on both sides.
LINKUSD (Kraken)
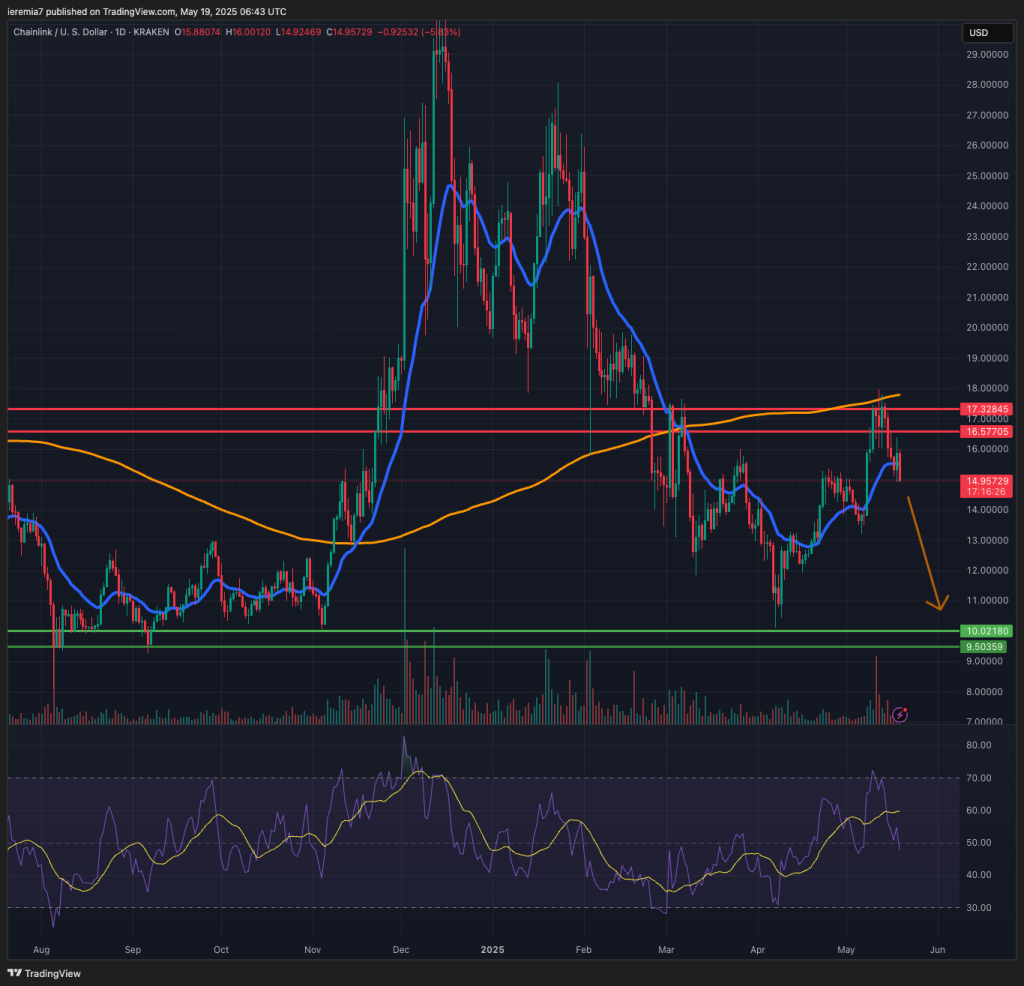
Chainlink is showing signs of weakness, suggesting once again that when Bitcoin tops, capital is flowing out of altcoins at a faster pace. Looking at the LINKUSD chart, we can easily notice how the daily 200 SMA acted as a key resistance zone again.
Strong selling after that is not an encouraging sign for buyers. If the 20 EMA does not act as support, we think there’s more downside to cover into $13 – $12. The main support lies below at $10, an area we mentioned in the past as well.
Buyers need to resume and drive the price above $17 + the 200 SMA. That will be the ultimate confirmation for the strong resumption of bullish flows. For the time being, it’s not the case, so we would like to caution against further selling this week. The move down will be aggravated if the broad market weakens.


There are no comments at the moment, do you want to add one?
Write a comment