
BTCUSD (Coinbase)
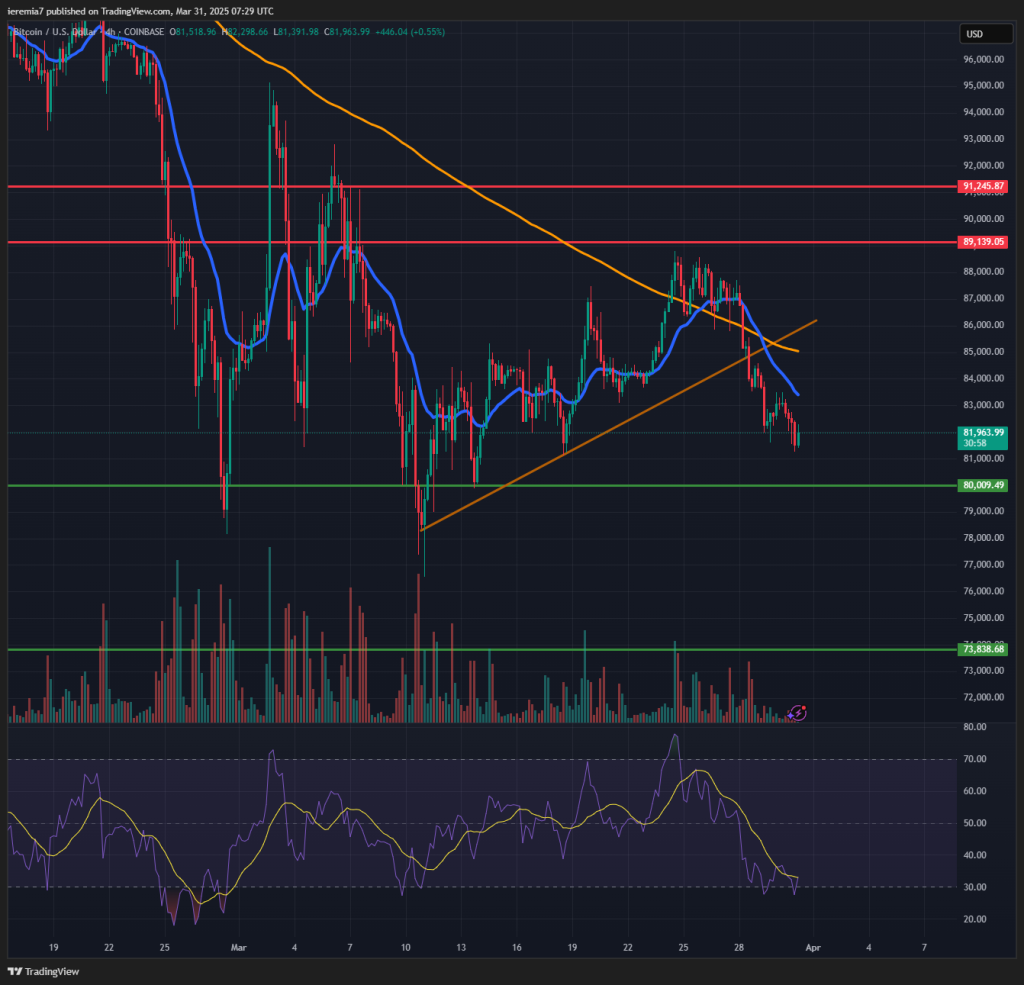
Bitcoin found resistance around $89k last week and then started to sell off impulsively. The price broke back below the 4h chart 200 SMA and even pierced through our short-term bullish trend line. These signals combined suggest sellers are the ones in control, and we don’t see an ease of tensions until markets have greater clarity on trade tensions.
April 2nd is a day to mark on your calendar because that’s when the US will announce a broad range of tariffs against its trading partners. Fear has spread across all markets due to this event and BTC has not been spared.
We think bearish pressure will continue until the administration releases details on its tariff plans. After that, the market could see relief if things are better than expected or continue selling if tariffs end up high, with no room for negotiation.
Too early to call that at this point, but we continue to see $80k and $73.8k as key support areas. On the upside, Bitcoin must break impulsively above the 200 SMA to show the order flow shifted in favor of buyers.
ETHUSD (Kraken)
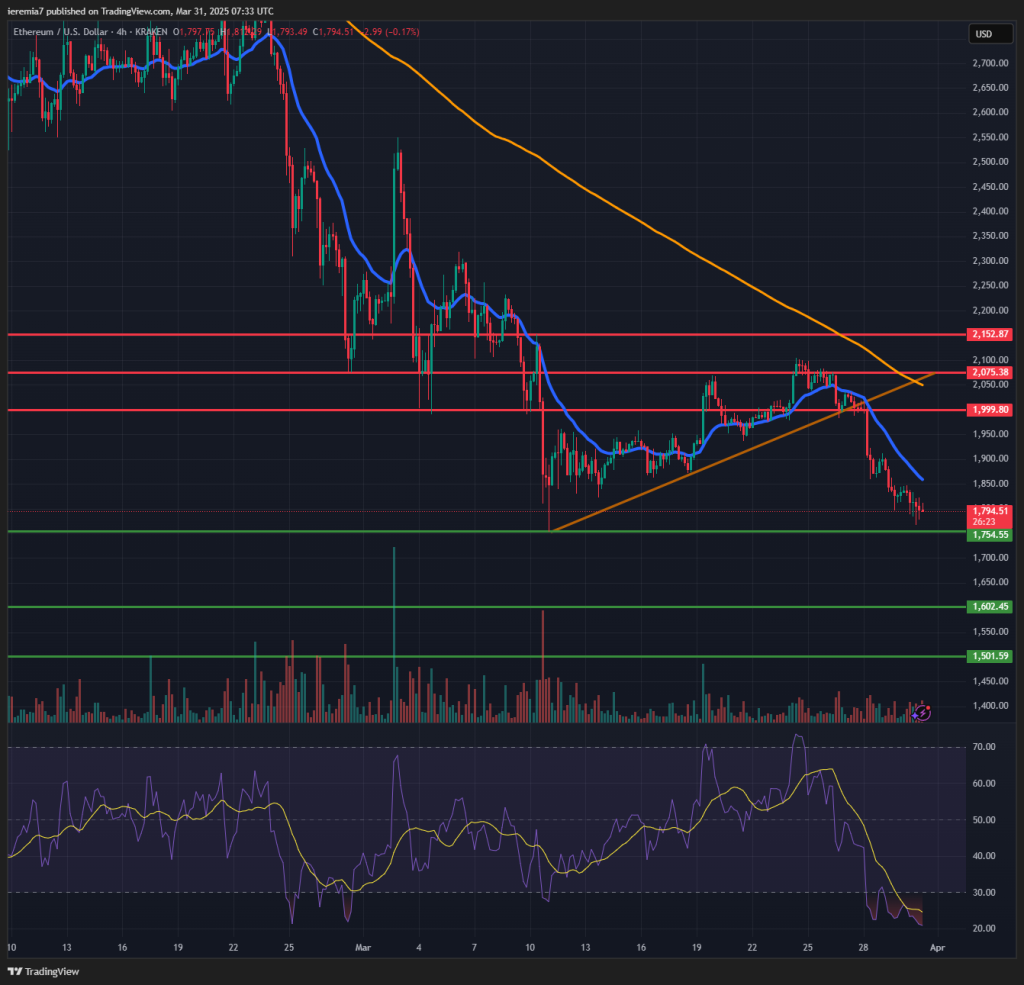
A similar pattern occurred in ETH since once the price broke below our ascending trend line, bears took control and pushed the market lower. We are now close to the March 10th low and that’s not an encouraging sign, especially since there’s no impulsive reaction from the buy side.
As a result, traders should expect the market to drop below $1,750, one of our key support levels. Further selling below will mean ETH could weaken towards $1,600 or even $1,500 if the trend gathers pace. We believe the price action will be highly correlated with BTC since a rise or ease of tensions later this week is the main factor expected to drive the order flow.
We will be more confident of a recovery only if Ether gets close to the $2,000 mark. Below that, rips are vulnerable in the face of renewed selling pressure.
LTCUSD (Coinbase)
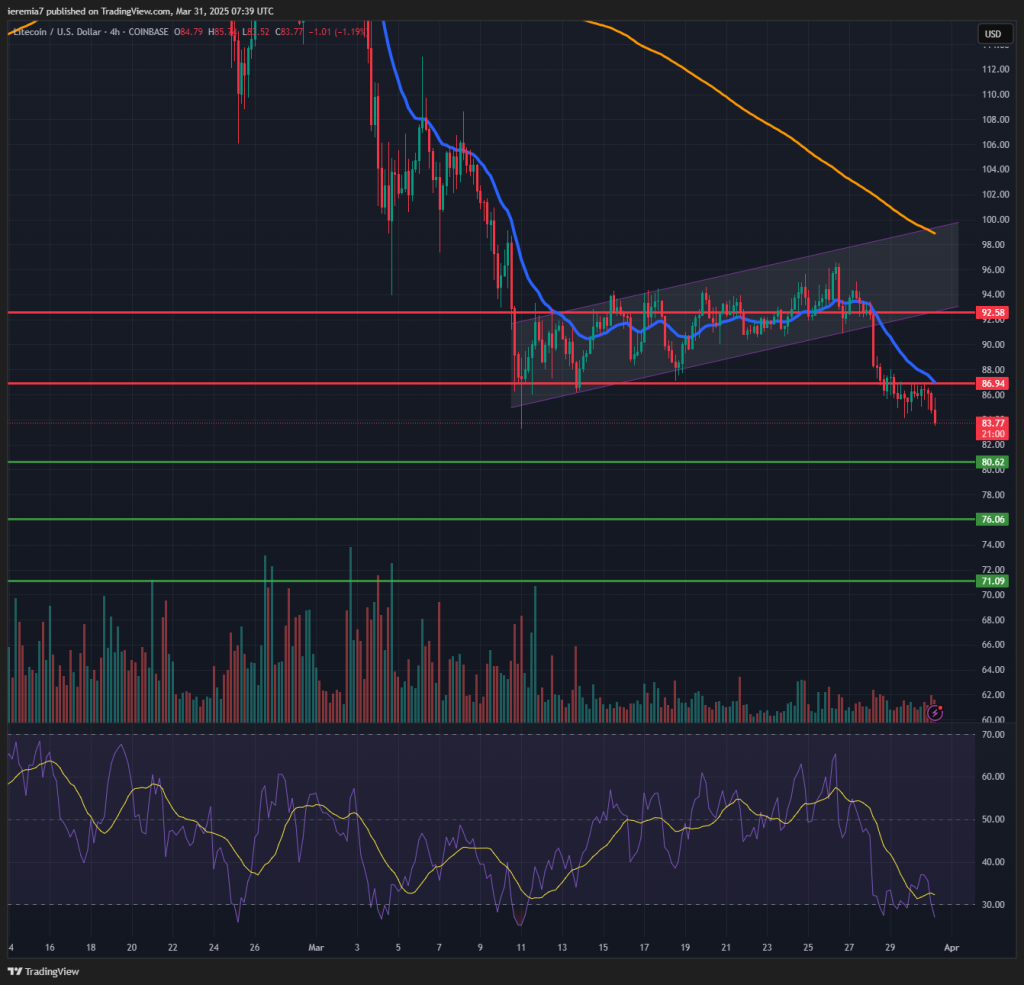
Litecoin is also seen under pressure, threatening to break below the March low. If that happens, we think selling could extend into the $80 key support. Below that, $76 and $71 are two other important support areas to watch for a pullback.
The broader picture shows a clear bearish advantage. After a weak consolidation structure, the selling resumed and eased all the gain within 3 days. This isn’t the type of price action buyers should be looking for.
With that being said, the bearish trend will stay in place until impulsive moves to the upside start to unfold. Even if that happens, the bottoming should take a couple of weeks at least. At some point, a stronger move to the upside should take place and that will mean $87 and $93 resistance points could be touched.
However, the long-term sentiment will stay bearish while LTC continues to trade below $96. Only a break above will suggest a technical change favoring buyers.


There are no comments at the moment, do you want to add one?
Write a comment