
BTCUSD (Coinbase)
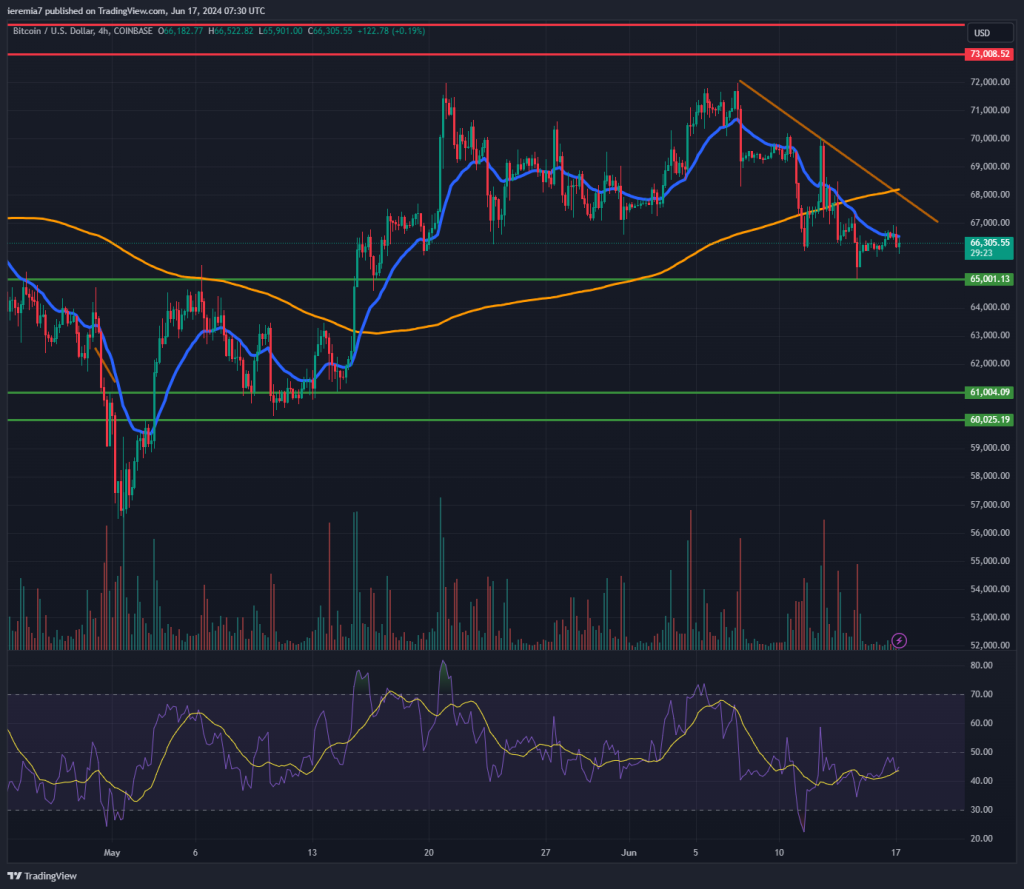
Bitcoin was choppy and ended last week in the negative. As our chart shows, the 4h chart 200 SMA failed to act as support, despite a temporary bounce off it. Looking ahead, we want to see whether the $65k level will hold as support.
The price action structure is not favorable for buyers at this stage, given we see lower highs and lower lows. As long as that doesn’t change, we think there’s scope for more selling. However, traders should take the recent swings with a grain of salt, considering trading volumes are very low.
If we see selling accelerating and volumes spiking, that will be a sign of weakness and Bitcoin could weaken toward the $61k – $60k support area. The market seems to be unattracted by the technical position and bulls have taken a break.
We will shift back to a bullish stance only if the price breaks above the 200 SMA and the falling trend line on our chart. That will be a clear sign of bullish strength and in the scenario, we might be better positioned to tackle the all-time high around $73k.
ETHUSD (Kraken)
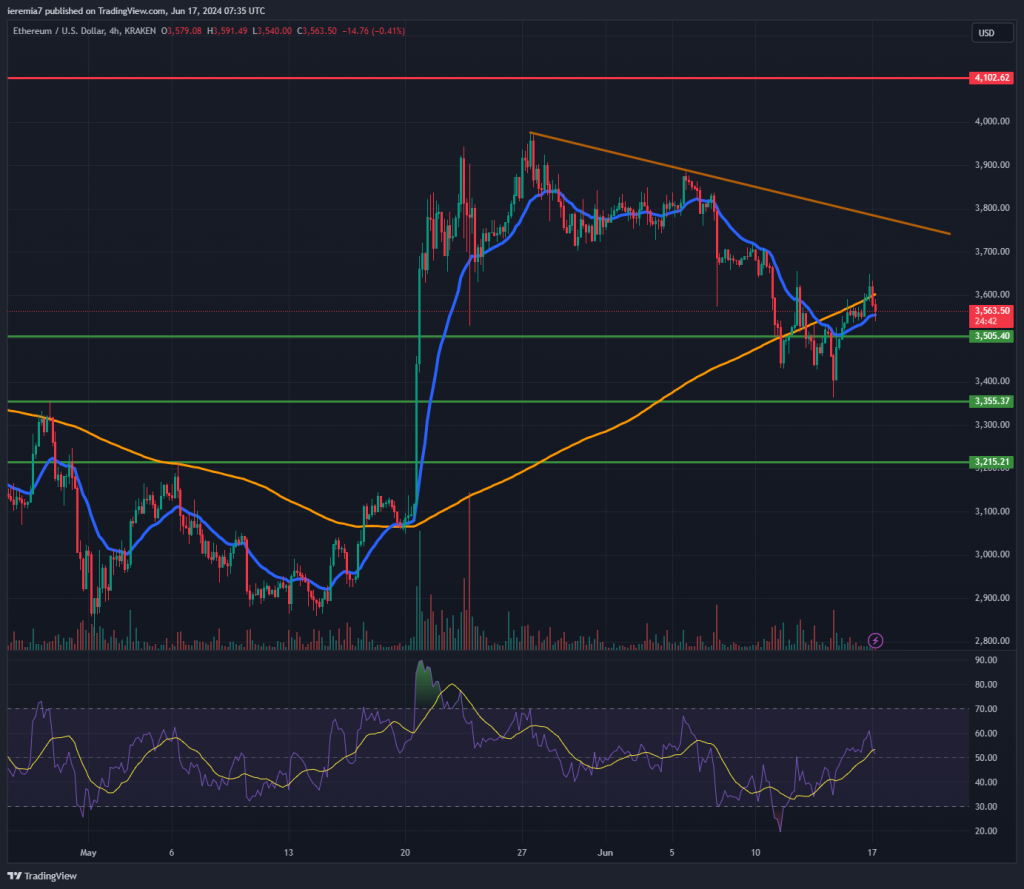
The same goes with Ether, which follows Bitcoin closely in terms of correlation. The enthusiasm regarding an ETF listed in the United States faded pretty quickly and now the market looks to be in a wait-and-see mode.
Gains have been erased and we can easily notice a bearish parabolic structure on the chart. As long as it continues, that could mean more selling in the upcoming days. Our main support levels are $3,500, $3,350 and $3,200.
ETH broke below the 200 SMA on the 4 chart but failed to continue lower. That shows some interest in dip buying, but not yet enough to confirm that the bullish sentiment resumed. The price has to break above the trend line we drew on our chart to suggest that the next very likely upside target will be $4,100. We don’t expect major impulsive moves in the week ahead, but short-term traders can still find good setups off the levels we’ve mentioned.
TONUSDT (OKX)
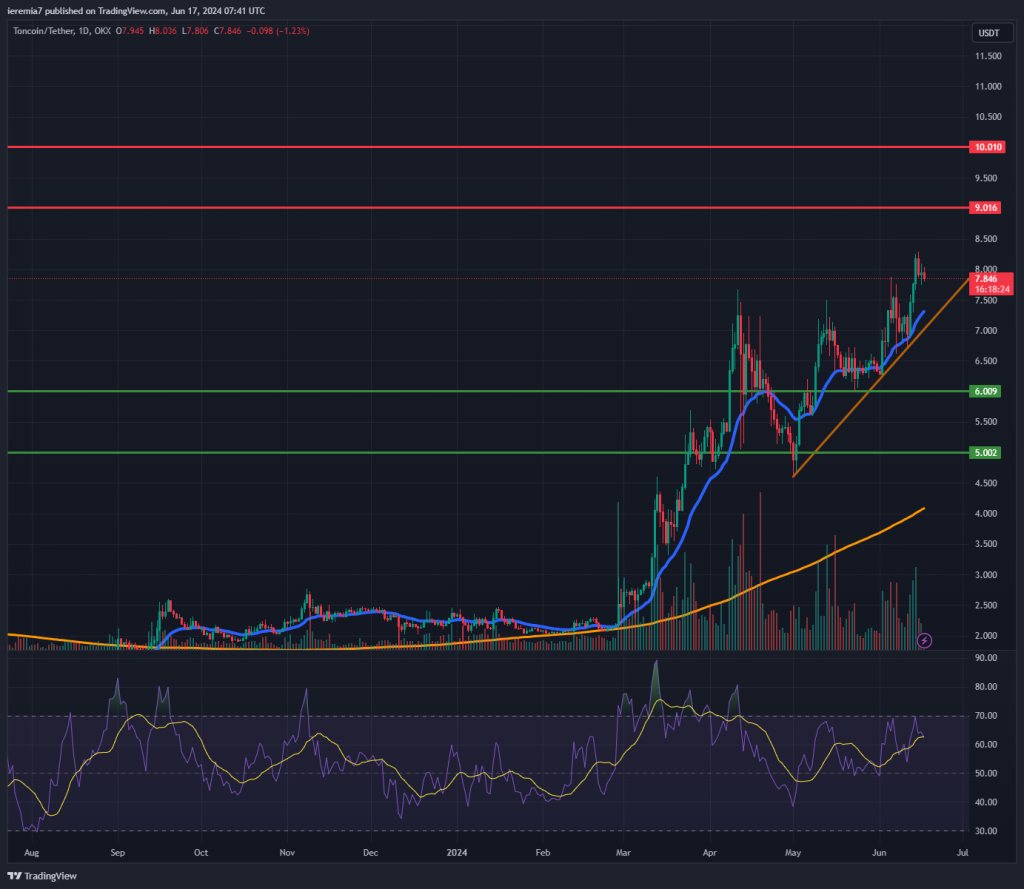
Even though the broad market breadth is weak, Toncoin ignores that and continues to march higher. This strong price action momentum, at a time when other altcoins are not following the same path, suggests there are traders still interested in driving this coin up.
The price has recently breached a ceiling around $7.5 and now looks poised to continue towards $9. Also, the daily 20 EMA acts as support each time a temporary dip occurs. Added to that, the RSI continues to be below the overbought level, suggesting a dull market.
This isn’t the right market to short, so we consider there is a pretty decent likelihood that TON continues to build up higher. The 20 EMA and the trend drawn on our chart, should be enough to cap the downside.
A strong break below will negate our bullish stance and suggest that the price could go to $6 or $5, before finding decent buyers again.


There are no comments at the moment, do you want to add one?
Write a comment