
BTCUSD (Coinbase)
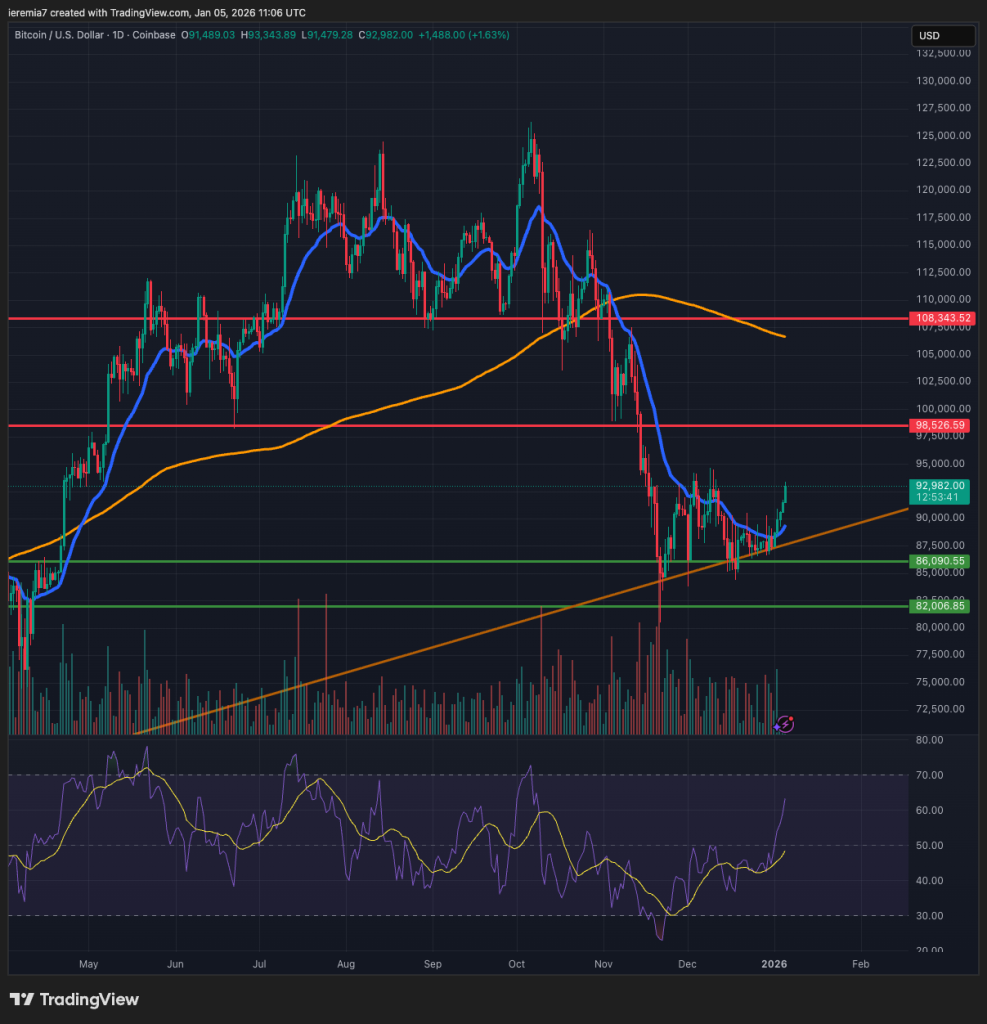
We are back with the first weekly crypto analysis for 2026 and Bitcoin seems to be on a positive footing. The price has bottomed out around an important trend line and now buyers are driving the order flow higher.
It will be interesting to see whether bulls can pierce through the December 2025 high. Should it happen, we expect more upside extension towards $98,500, our first major resistance zone. Naturally, the $100k area will be important there since it’s a psychological number.
Keep in mind this is just the beginning of January and liquidity hasn’t returned to normal levels, which leaves the price vulnerable to sharp moves on both directions. Also, BTC continues to trade below the daily 200 SMA and that means there’s a lot to catch up before we can reclaim the upward trend.
Still, the RSI is edging up towards the 70 area on the daily chart and that suggests there is at least a short-term bullish leg in play. Below the trend line, we see $86k and $82k as support levels to watch.
ETHUSD (Kraken)
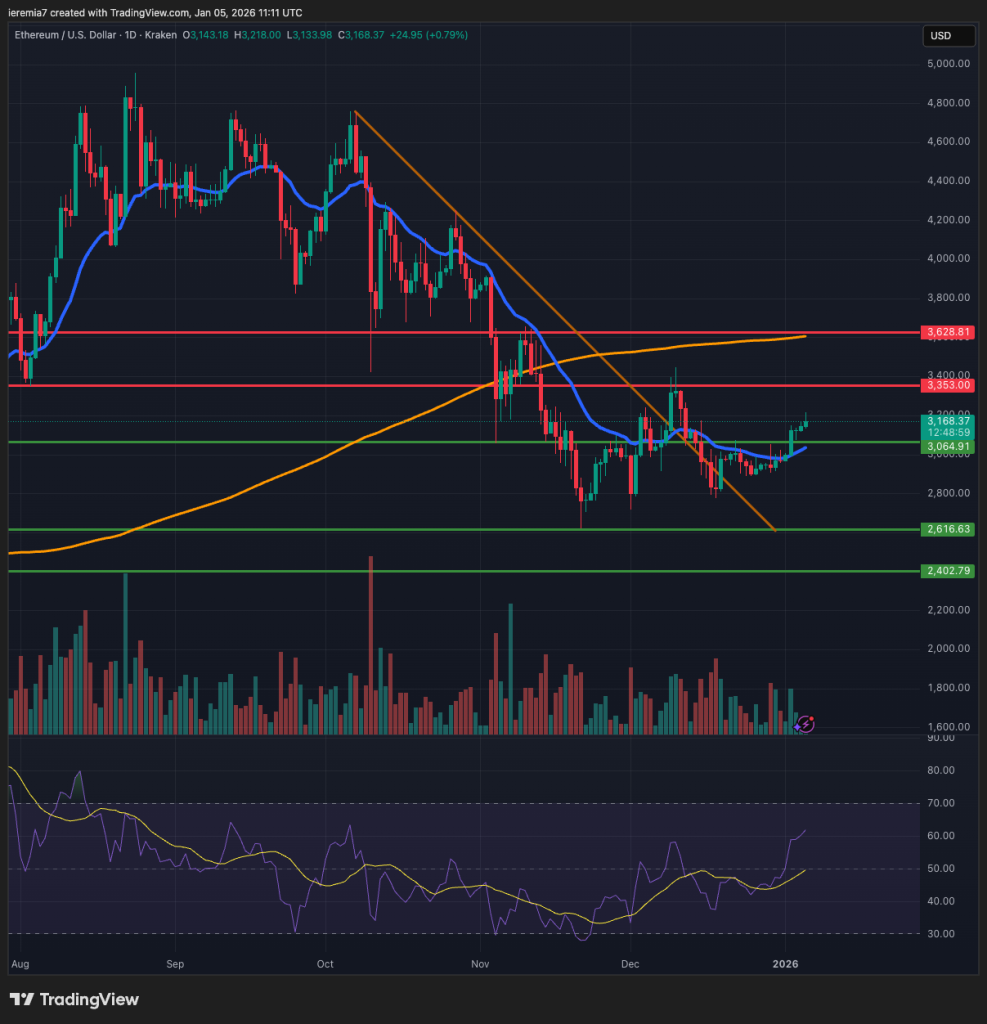
Ether looks a bit better when compared to BTC, because in this case, the price action broke above a bearish trend line in December, then pulled back to the broken line. For the past week, there has been a slow grind higher, suggesting an accumulation of buyers might be developing under the surface.
This is usually a bullish setup and as long as there won’t be any negative news to dampen the sentiment, we favor an upside continuation this week. The first line of resistance comes at $3,350, followed by $3,650, where the daily 200 SMA is also located.
Downside support is located at $2,600, should the sentiment turn heavily bearish. The series of higher lows on the daily chart suggests that buyers are willing to step in on dips, reinforcing our current bullish stance.
A strong break above the December high will confirm an overall bullish structure and from there, it will be possible to build on more gains. As usual, we will officially claim a bullish territory only after the price breaks and holds above the daily 200 SMA.
XRPUSD (Kraken)
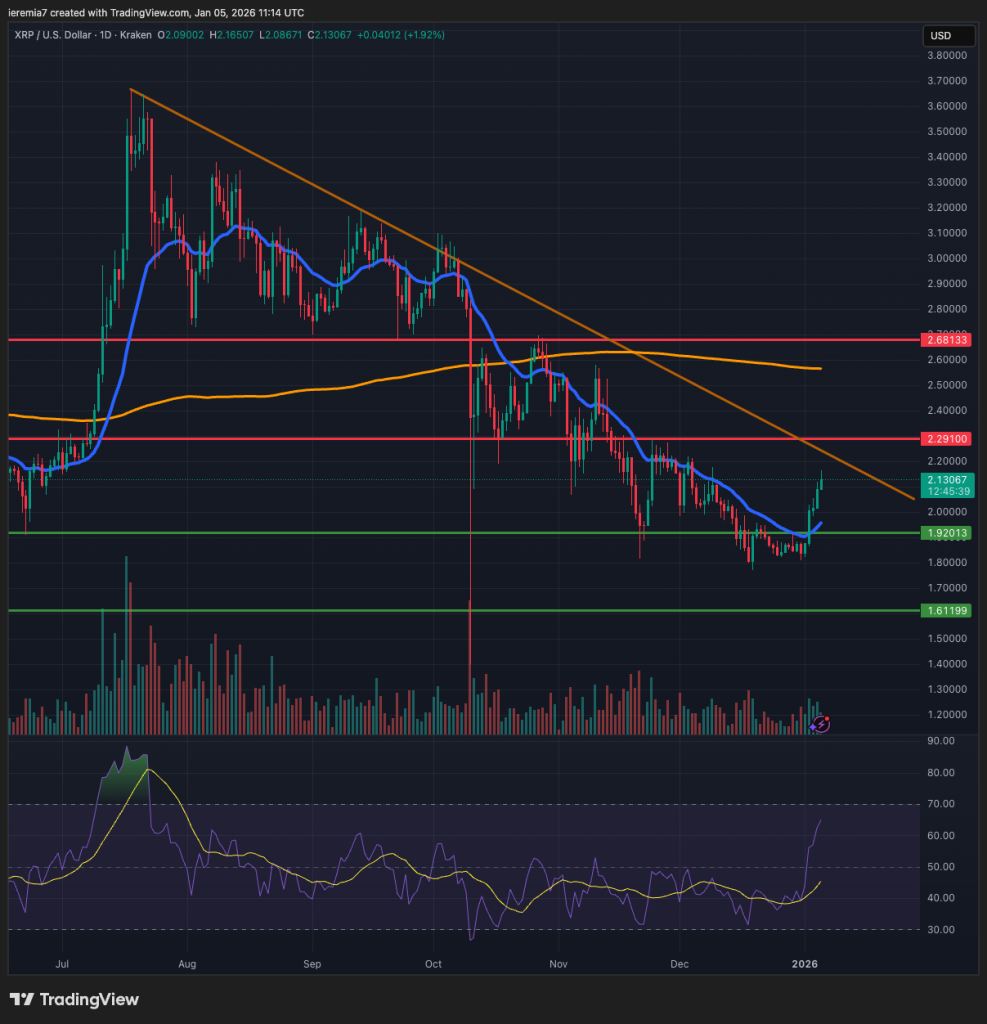
XRP has breached above the daily 20 EMA and for the past 4 days, we have seen consistent buying. The price is getting close to a bearish trend line that goes back to July last year. Some selling should be expected there, but given the impulsiveness of the leg up, traders must monitor closely how the price action will develop from there.
Weaker selling activity might be the early sign for a break and continuation higher towards $2.3 and even $2.7 in the mid-term horizon. Seasonally speaking, January is a positive month for risk appetite and crypto might be favored.
In case heavy selling prevails, watch for support in XRP at $1.92. Breaking below the December lows will be a bearish sign, based on our current assessment.


There are no comments at the moment, do you want to add one?
Write a comment