
BTCUSD (Coinbase)
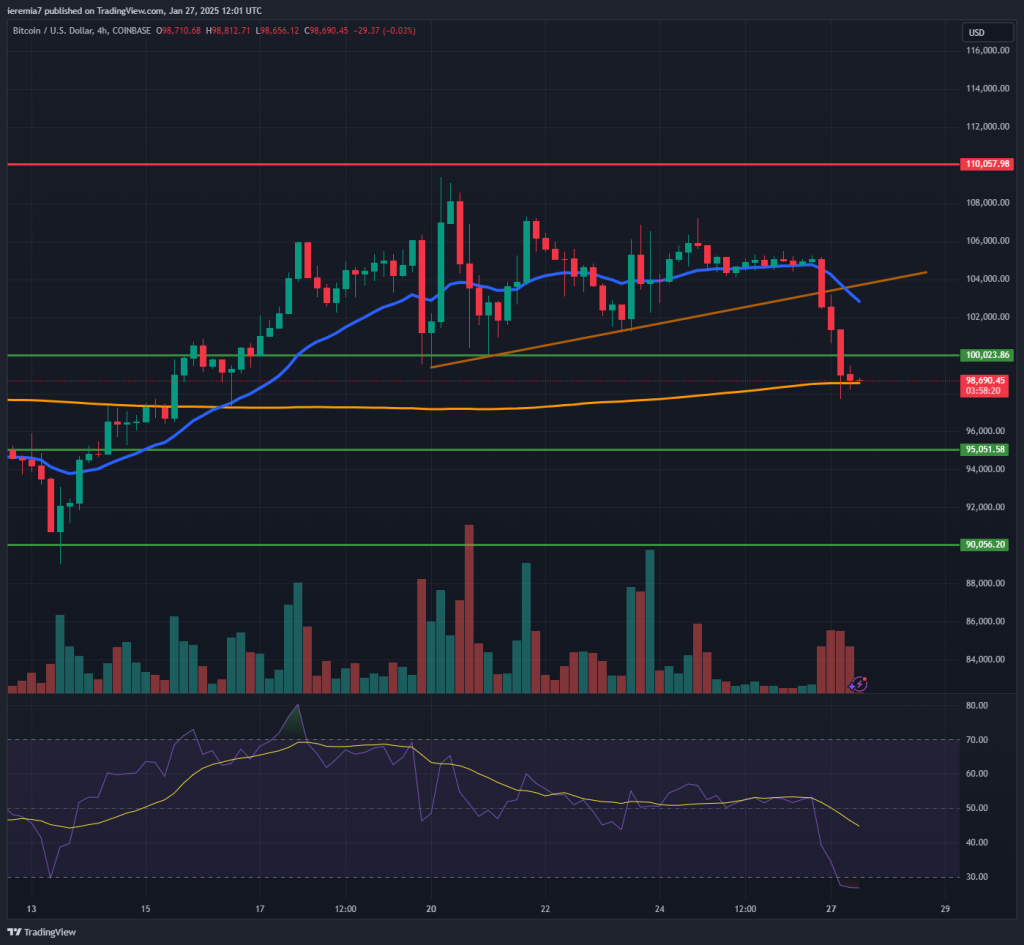
This week starts with negative sentiment since Bitcoin is seen down almost 4% today. After an initial pop following Trump’s inauguration, the market took on a sell-the-fact path, unable to touch the $110k resistance we discussed a week ago.
BTC is breaking lower, currently testing the 200 SMA on the 4h chart. Sellers already cleared buyers from the market, given the price is now below a short-term ascending trend line. While the oversold RSI might suggest a bounce is due, be aware the market is still not oversold on larger time frames.
If selling continues unhinged, the next targets to watch are $95k and $90k. There’s a growing chatter about a correction towards the $70k area and we think traders need to consider that as well. Since the crypto space is mainly driven by flows, fear of larger moves lower can accelerate selling interest.
On the upside, we need to see the price breaking above the $104k area to consider a change in sentiment. Only after that traders can hope for a new ATH around $110k.
ETHUSD (Kraken)
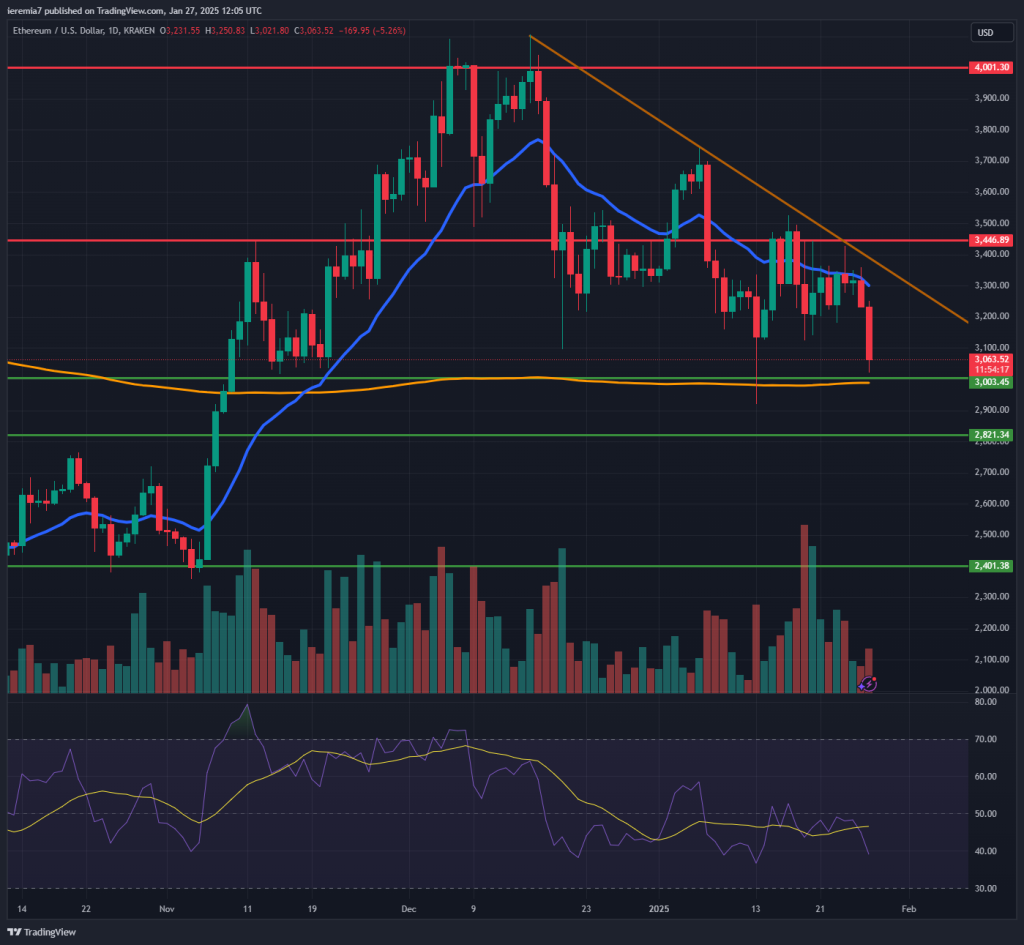
Ether displays a similar weakness and as our chart above shows, the bearish trend remains in play, acting as overhead resistance. The price retested it 4 days ago and since then, sellers have been dominating the order flow.
As a result, we think $3k is the next support, combined with the daily 200 SMA as well. Further selling below that zone will be a bearish sign and attention will shift to $2,800 in that case. The picture is getting worse for bulls since lower highs and lower lows suggest a market in which sellers end on top.
The key to unlocking a new impulsive leg up is breaking the trend line, which for now, seems less likely. Only in that scenario, we can envision a path back to $4,000. As things stand right now, there’s room for additional selling, especially if the FOMC turns out to be a negative surprise for risk assets again.
TRXUSD (Bitfinex)
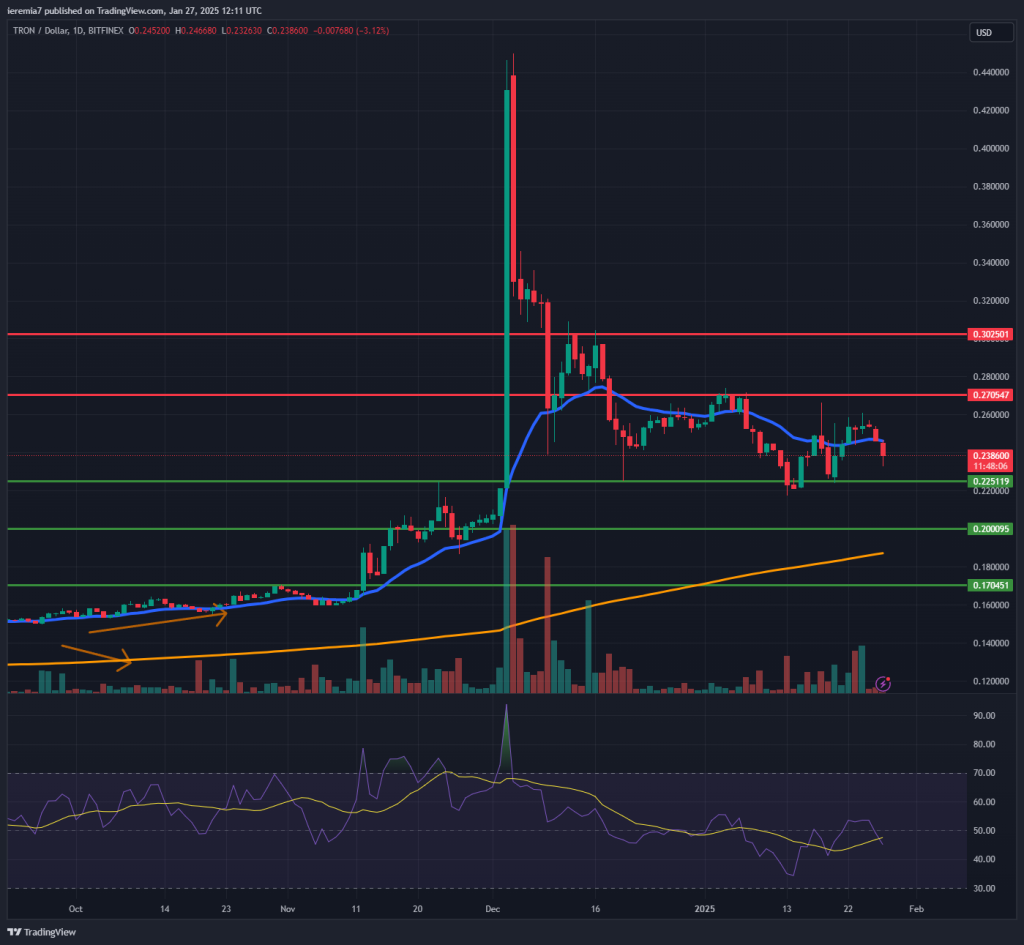
Tron saw an impulsive push higher at the beginning of December 2024, but it looks like that was just a pump and dump. The market topped around 44 cents and since then erased almost all gains.
We are now coiling towards the downside and it seems sellers continue to hold the upper hand. We see support at 22 cents, 20 cents and the daily 200 SMA. On the upside, buyers need to clear out the resistance at 27 cents to confirm a higher high.
There are no signs of enthusiasm for now and the current broad market selling doesn’t help at all. In fact, if all the other major coins continue to sell off, then TRX should follow the same path. Excessive returns compressed in a short time frame usually lead to violent reversions to the mean, which is exactly what Tron is currently facing. We expect more short-term selling opportunities to emerge during the next couple of days.


There are no comments at the moment, do you want to add one?
Write a comment