
BTCUSD (Coinbase)
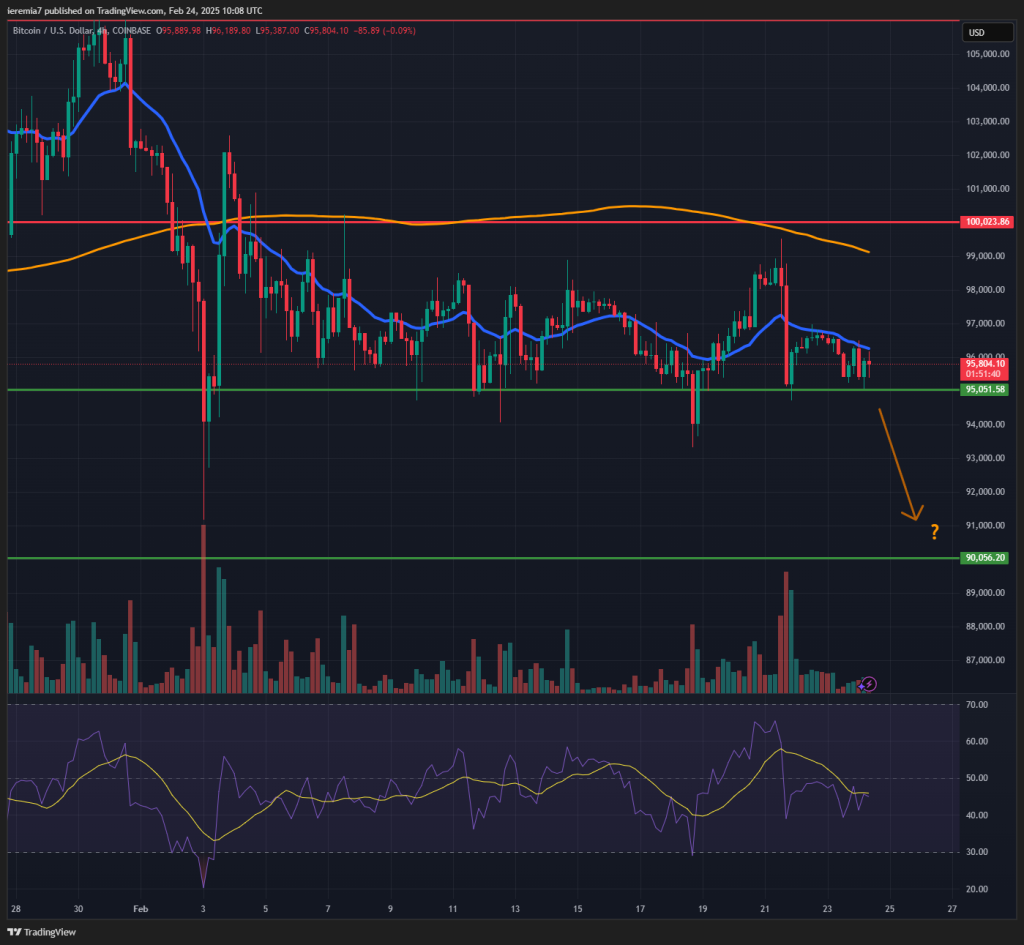
Bitcoin continued to trade range-bound last week and after a decent jump to $99k, it reversed course on news that ByBit was hacked and lost $1.5 billion. The price didn’t face heavy pressure because most of the stolen crypto was in altcoins. However, such events are negative for confidence in the industry, meaning we could see selling from this point forward.
Sellers seem to be pressuring the $95k support and if that breaks, the next likely target will be $90k. The price action context hasn’t changed in favor of bulls because each pop above the 4h chart 20 EMA is met with impulsive selling. Buyers will need to see the price above the moving average and also the blue line treated as support, instead of resistance.
At the same time, a break and hold above $100k will be the signal to watch for a return of bullish sentiment. Until then, we are cautiously bearish, expecting some more pain before heavy buyers return to the market. You should also watch how tech stocks perform this week because there is a correlation with crypto as well.
ETHUSD (Kraken)
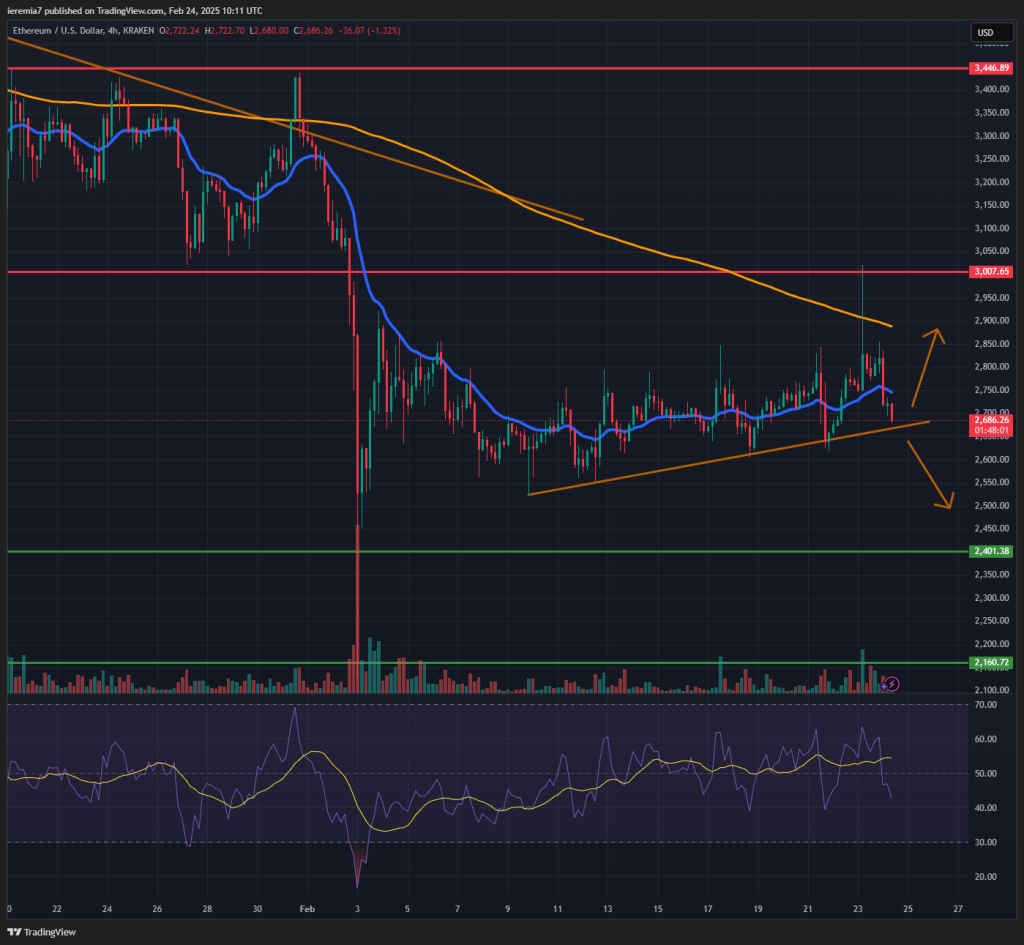
Our last ETH analysis turned out to be right since the trend line held and what followed was a strong push into $3,000, a key resistance level. Sellers emerged there impulsively and now we see the price retesting the trend once again.
The script is pretty simple moving forward if buyers continue to treat the trend line as support and the price starts to rise impulsively, we expect a leg up into the 4h chart 200 SMA located around $2,900. It would be a strong bullish sign if the price manages to break and hold above the $3,000 area.
Conversely, if sellers push the price below the trend line that would be bearish and could signal a move towards $2,400 or $2,160. At this point, any of these two scenarios can unfold.
ADAUSD (Binance)
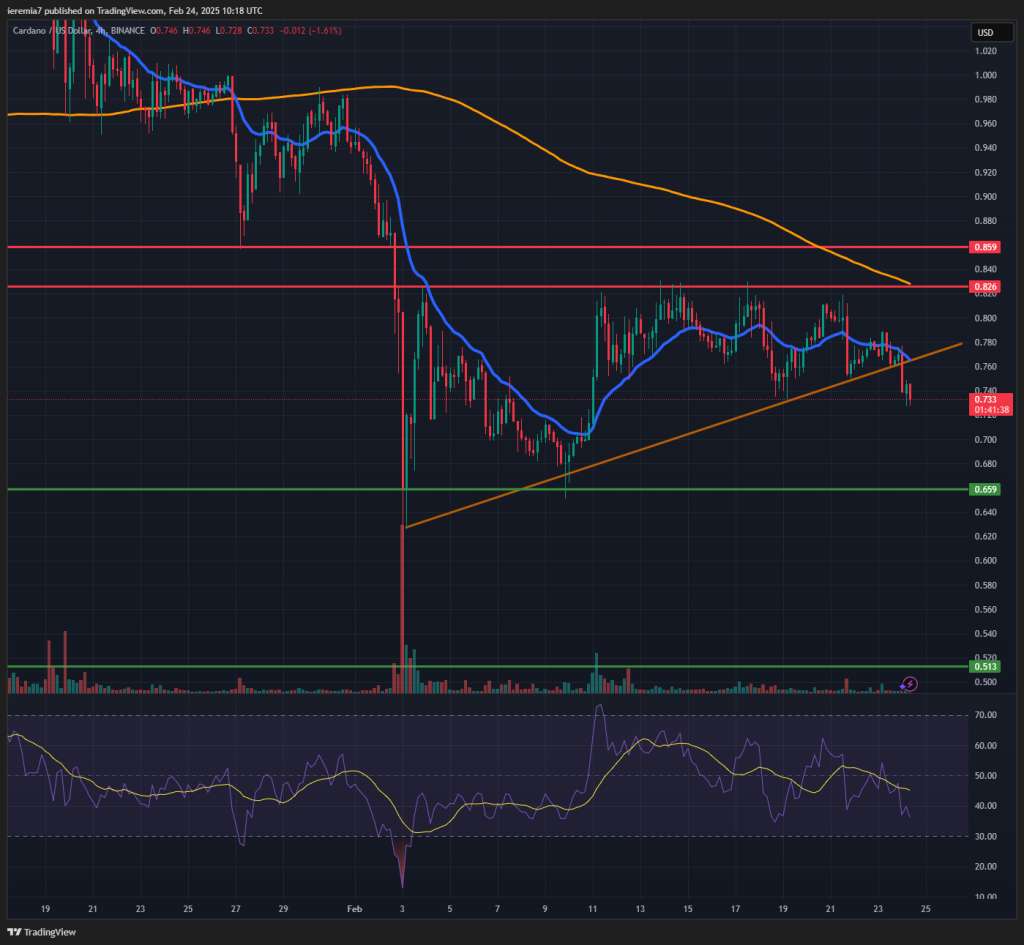
Cardano is starting to show signs of weakness after consolidating for two weeks. We see how the 82.6 resistance acted as a ceiling for the move and now sellers are the ones driving the order flow.
Another advantage for them is the break below the trend line posted on our chart, which adds to the overall bearish tilt. As things stand right now, we think there’s scope for additional selling and the next support levels to watch are 67 cents and 52 cents. The lather is where the flash selling on Feb 3rd started.
The current price action might also turn out to be a major bottoming if buyers step in on dips. That’s not the case so far, but if it happens, we need to see a break above 82.6 cents + the 200 SMA. That will be an encouraging sign and buyers will be able to build a longer-term move on such positive developments. However, we are cautiously favoring selling at this point.


There are no comments at the moment, do you want to add one?
Write a comment