
BTCUSD (Coinbase)
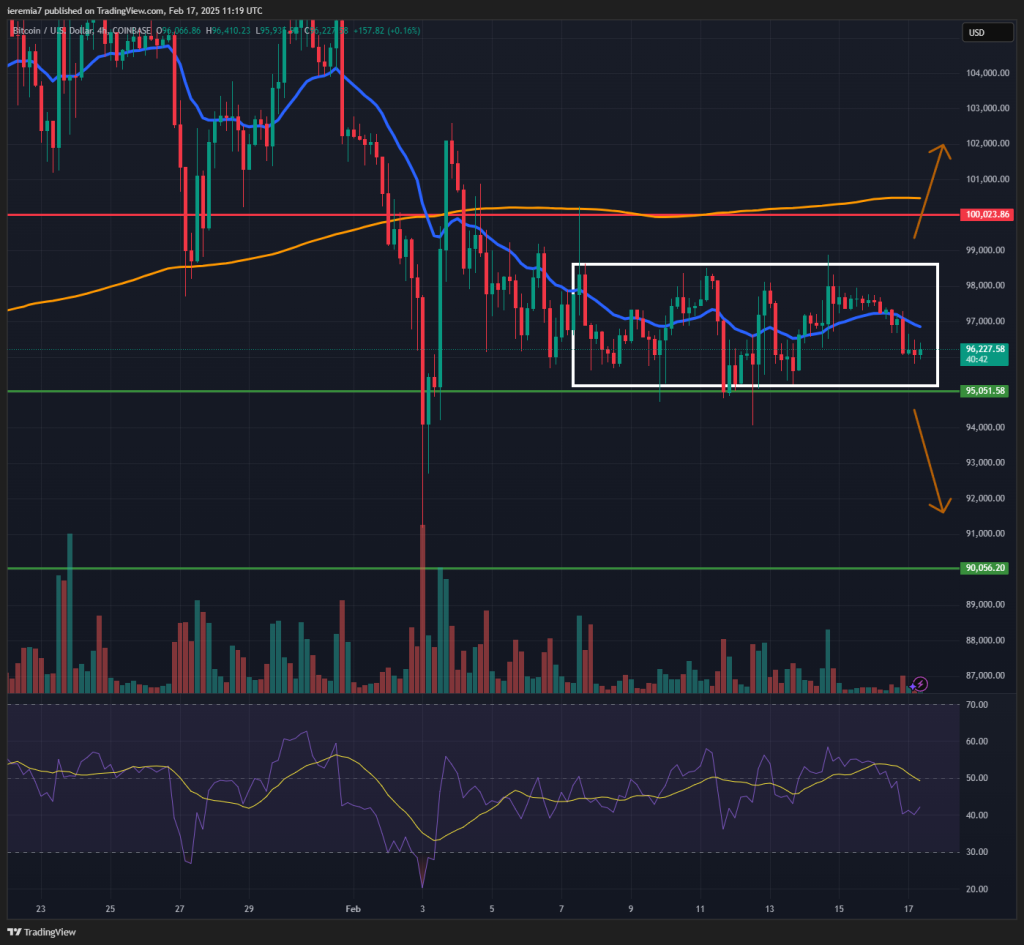
Bitcoin volatility dropped last week, given the price has traded inside a narrow range. There seem to be strong offers around $98,600 and bids at $95,000, so far keeping the market contained.
At some point, the range will break and when that happens, we expect volatility to pick up again. As a result, an upside breakout will be a bullish sign and traders should expect an extension towards the 4h chart 200 SMA + $100k key resistance level. We think bulls can push the price further and attention might shift to $110k again.
Enthusiasm has cooled down for now, and maybe market participants are waiting for major headlines to drive the next leg. That hasn’t occurred yet, meaning the bearish scenario should be considered.
Breaking below $95k will show weakness, and in that case, we think the price can ease towards $90k, where stronger bids might wait. At the same time, such a move will deteriorate the favorable bullish structure, so keep that in mind as well. The second half of February is not the best in terms of seasonality, meaning trading ranges should remain narrow.
ETHUSD (Kraken)
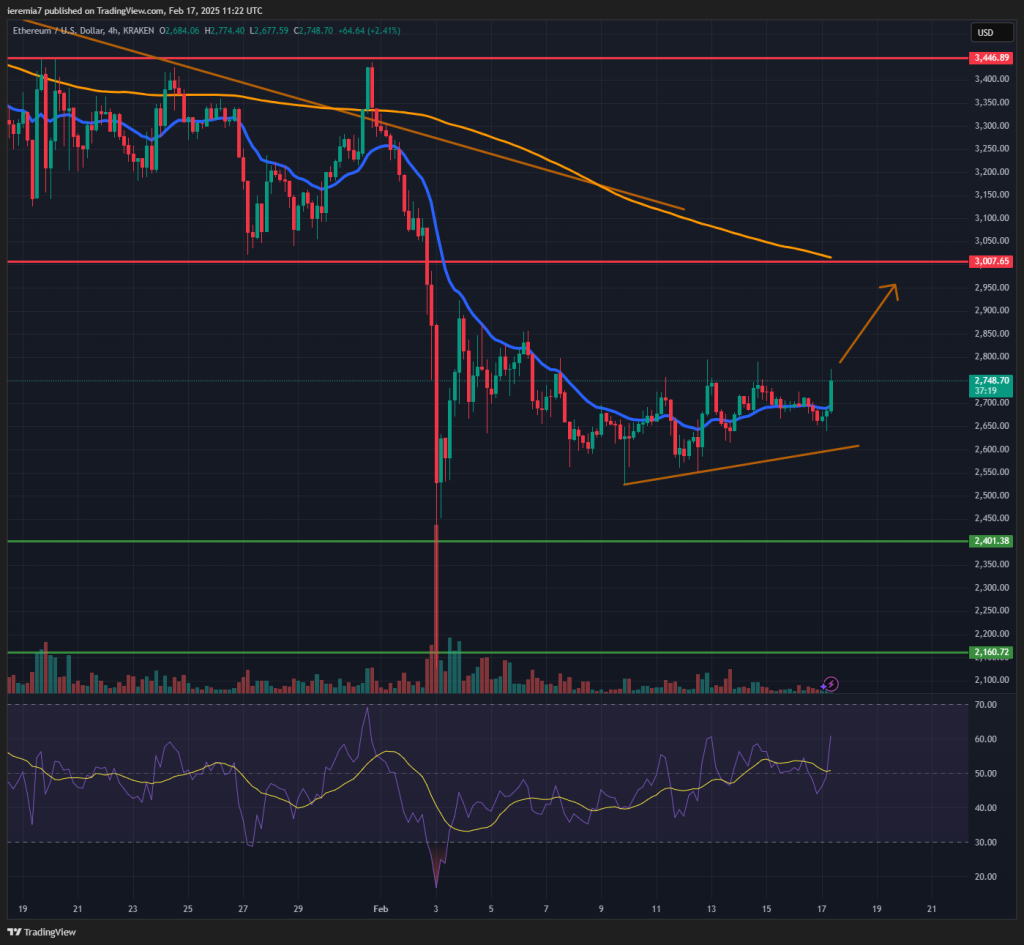
Ether continues to consolidate after the flash crash, and that’s an encouraging sign. It would have been bearish if selling continued, but as the market stands right now, buyers managed to balance things out.
Additionally, we are starting to see higher lows and higher highs + a short-term ascending trend line. If this structure is not invalidated, we think ETH might be poised for further upside during the days ahead. The main area of resistance is $3,000, where the 4h chart 200 SMA overlaps as well. If the market gets to that point, even though some short-term weakness emerges, buyers will have more favorable conditions.
A break below the trend would be negative, and we think ETH could retest $2,400. Still, usually, a flash crash suggests a bottoming, so expect weakness to be bought by opportunistic traders.
LINKUSD (Kraken)
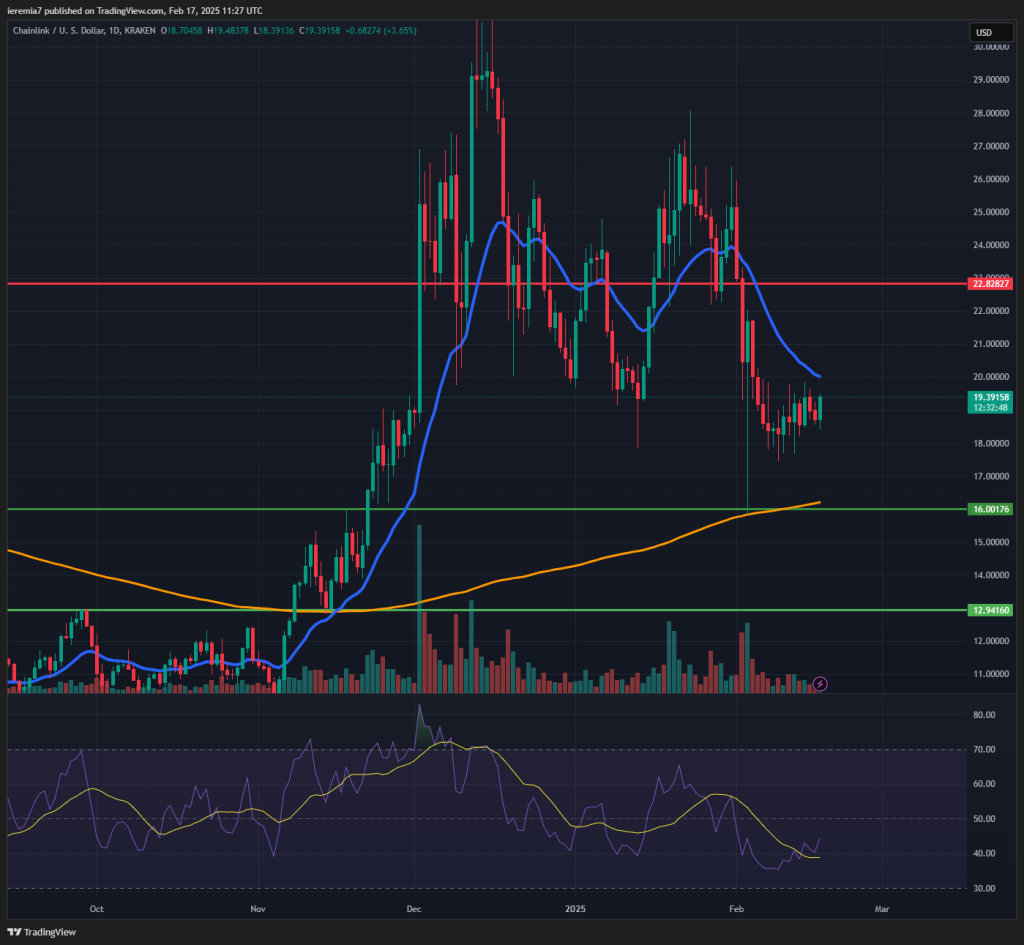
Let’s also have a look at Chainlink, an altcoin closely correlated with Ether. We see the same script – a sudden drop followed by balanced price action and now increasing bullish interest.
Even though the price continues to trade below the daily 20 EMA, we see more upside room ahead. The key resistance level to watch is $22.8, suggesting some potential gains for buyers.
The series of lower highs and lower lows on the daily is a sign of weakness long-term, but as you can see, each dip is followed by strong bullish action. It might be the case that LINK is actually consolidating inside a larger bull trend, and thus, buying dips means an opportunity to enter at affordable pricing.
Based on our current assessment, we see Chainlink in a range between $22.8 and $16 (+ the daily 200 SMA). Breaking this area is a must to see which side of the market holds the upper hand. Hard to say at this point who will win.


There are no comments at the moment, do you want to add one?
Write a comment