BTCUSD (Coinbase)

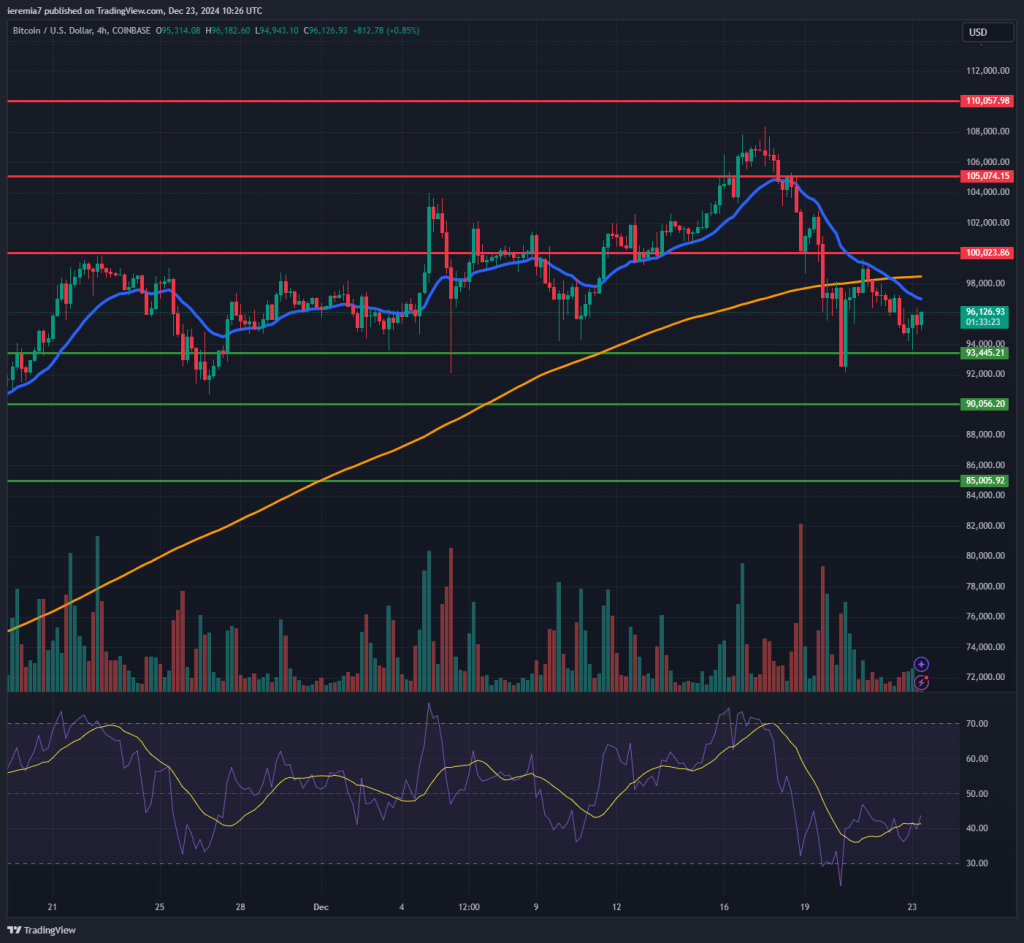
We’re back with the last weekly crypto analysis for 2024. Bitcoin had a wild run last week after a hawkish FOMC tumbled all financial markets. The price is now trading below the $100k mark and also below the 200 SMA on the 4h chart.
At the time of writing, we’re seeing some short-term bullish interest, but in order to continue, the market must break above the $98k level and then do the same with $100k. While the Santa rally could push BTC higher, traders should expect narrow ranges this week.
Based on our current projections, we see Bitcoin locked in a range between $90k and $100k. A breakout on either side might be met with counter-trend flows since liquidity is thin and it’s hard to see a continuation.
Most likely, volatility will pick up again only after the new year, when most traders get back at their desks. If you still want to trade this week, we advise a cautious approach and only trade setups that form around key support/resistance levels.
ETHUSD (Kraken)

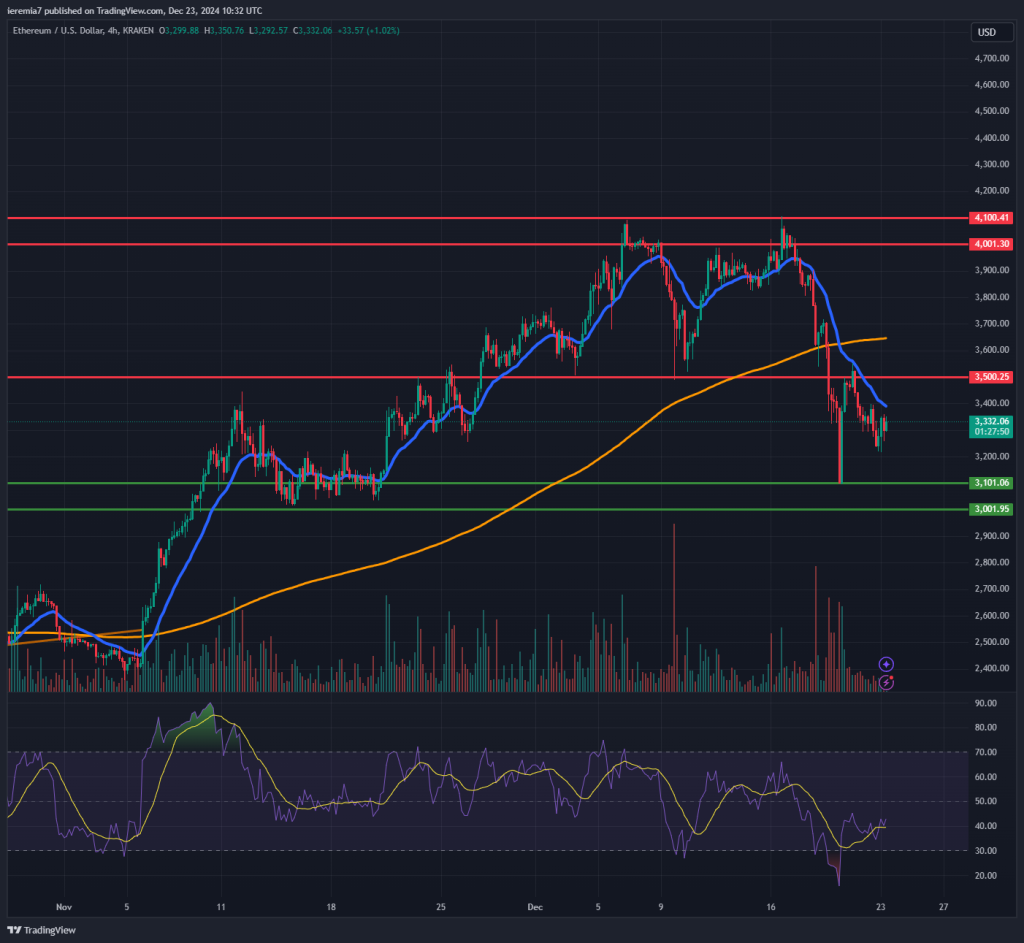
Last week we wrote that $4,000 – $4,100 is a key resistance zone and that turned out to be true. As the chart above shows, the market slumped 25% from the highs, and the risk sentiment deteriorated after the FED meeting.
Attention shifted to the $3,100 – $3,000 support zone and so far, the upper side of that area managed to cap selling. Looking ahead, we want to see ETH breaking the 20 EMA on the 4h chart. The RSI is above the oversold area, pointing upward, suggesting a slight improvement in sentiment.
Traders should watch $3,500 as the next important resistance and if that is breached, we will shift our attention to the 200 SMA. We don’t expect a major recovery this week, but the probabilities are in favor of buyers since the Christmas period is bullish for crypto after a positive year like the one we had.
LINKUSD (Kraken)

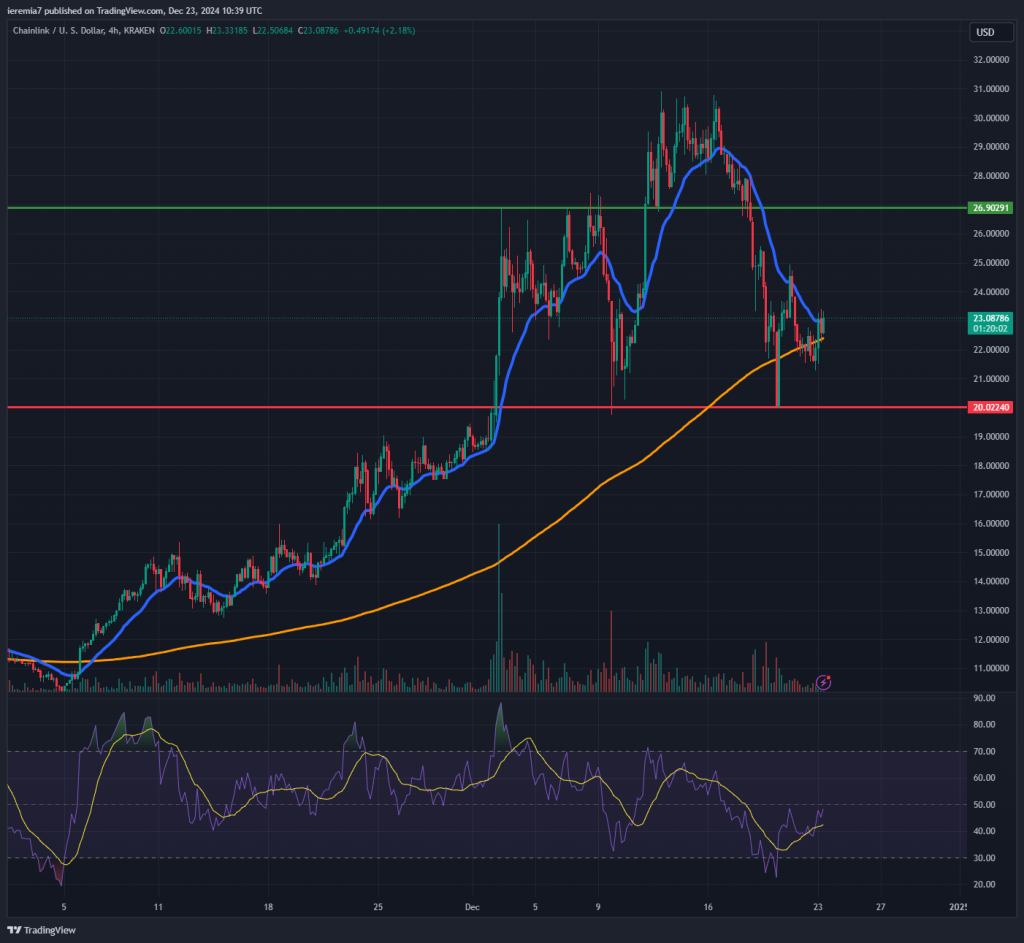
The 3rd coin we want to discuss today is Chainlink and mainly because a potential head-and-shoulders pattern might be in the making. As the chart shows, the price dropped and found support at $20, where the neckline is currently located.
If the pattern is legit, we should see a recovery towards the $26 area, where the top of the left shoulder is located. The H&S pattern will be negated if the market breaks impulsively above that zone and even pierces through the current 2024 high.
The holiday period should prevent a further drop in LINK, but once 2025 kicks in, the sentiment could start deteriorating once again. Traders who managed to open long positions early and are now deep into profit might want to take advantage of the holidays to trim exposure.
All in all, LINK is bullish above $20 and we’ll shift to bearish on a break below that key level. The team behind Crypto Frontline wishes you all “Happy Holidays!” and we’ll see you again in 2025.


There are no comments at the moment, do you want to add one?
Write a comment