BTCUSD (Coinbase)
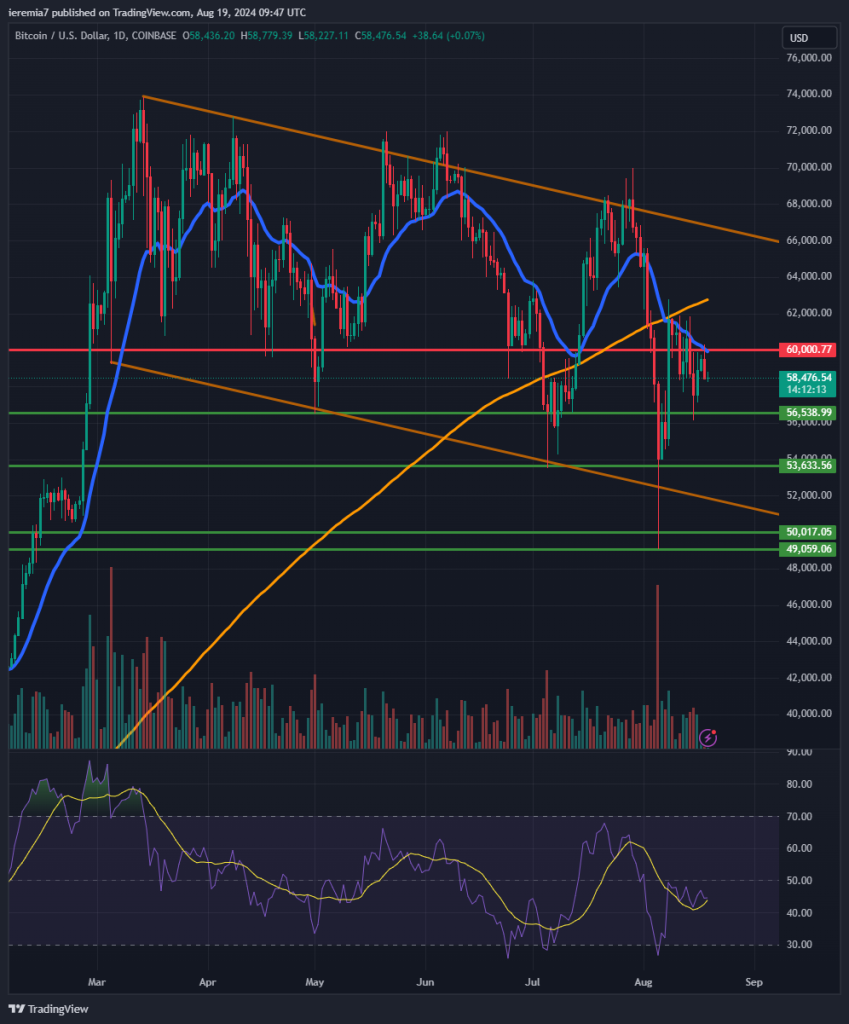
Bitcoin ended flat last week as volatility compressed. Even though the risk sentiment improved across all financial markets, it did not end as a positive factor for BTC’s performance. We believe the main reason for that is the break below $53k. That generated a lower high and now buyers need to see a bottoming structure before stepping in more confident.
The main risk event for this week is Jerome Powell’s speech at the Jackson Hole Symposium on Friday. Markets might be range-bound until then, but we believe it will turn out to be a non-event, given the FED chair probably won’t commit to a particular rate path. After the impulsive drop seen in major stock markets, the last thing he wants is to add more fuel to the fire.
Technically speaking, the $56.5k is the first line of support to watch, followed by $53k. The consolidation structure we highlighted last week remains in play, so the lower bound is another support.
In terms of resistance levels, the daily 20 EMA + $60k should be watched. We’ll turn bullish on BTC only if the price manages to break and hold above the daily 200 SMA. The RSI is still below 50, so we have plenty of room for a recovery.
ETHUSD (Kraken)
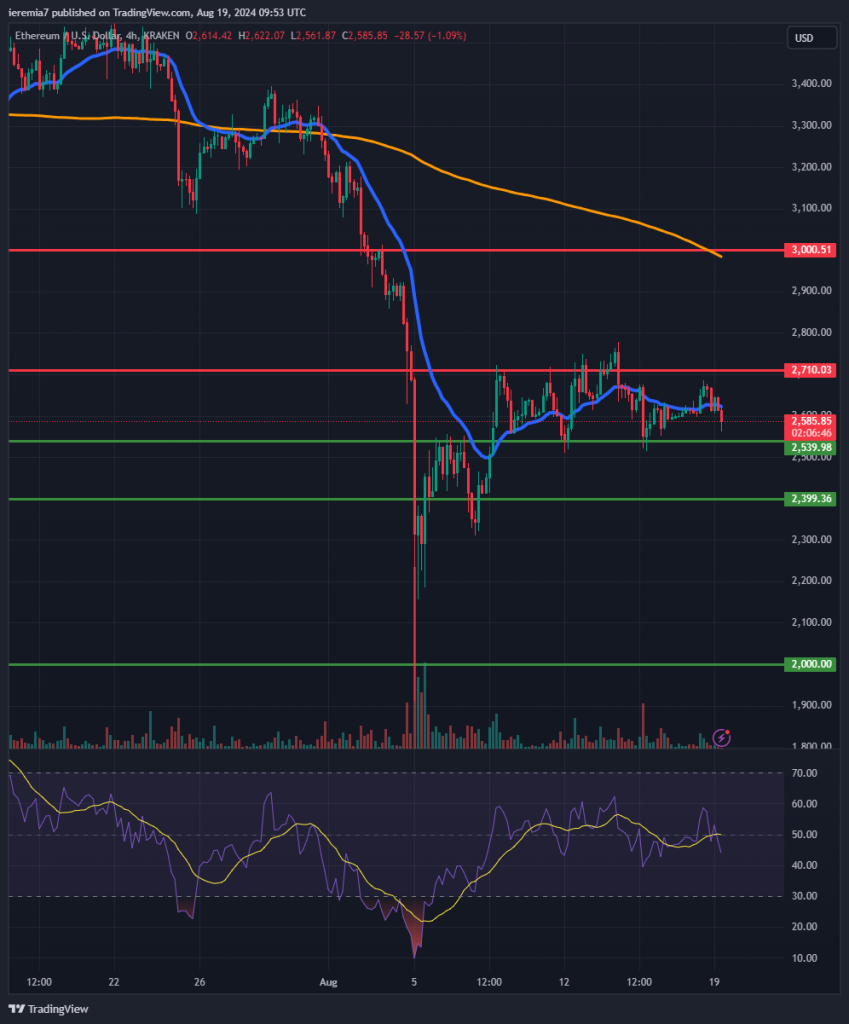
Ether is also struggling to find direction, but in the broader scheme, we think this might end up as a bottoming formation, so we are bullish longer-term. While the end of summer should remain choppy and with no directional bias, things should improve as we get close to October when seasonality generally improves substantially.
Despite that, we should see many short-term trade opportunities in the meantime. We think $2,500 is a key support and if it fails, buyers will switch attention to $2,400. Losses should be limited this week, based on our current assessment.
To the upside, $2,700 was a resistance level recently and sellers could be parked there. Breaking above will be a positive sign and we’ll shift our attention to the $3,000 area, which should act as a resistance as well.
TRXUSD (Bitfinex)
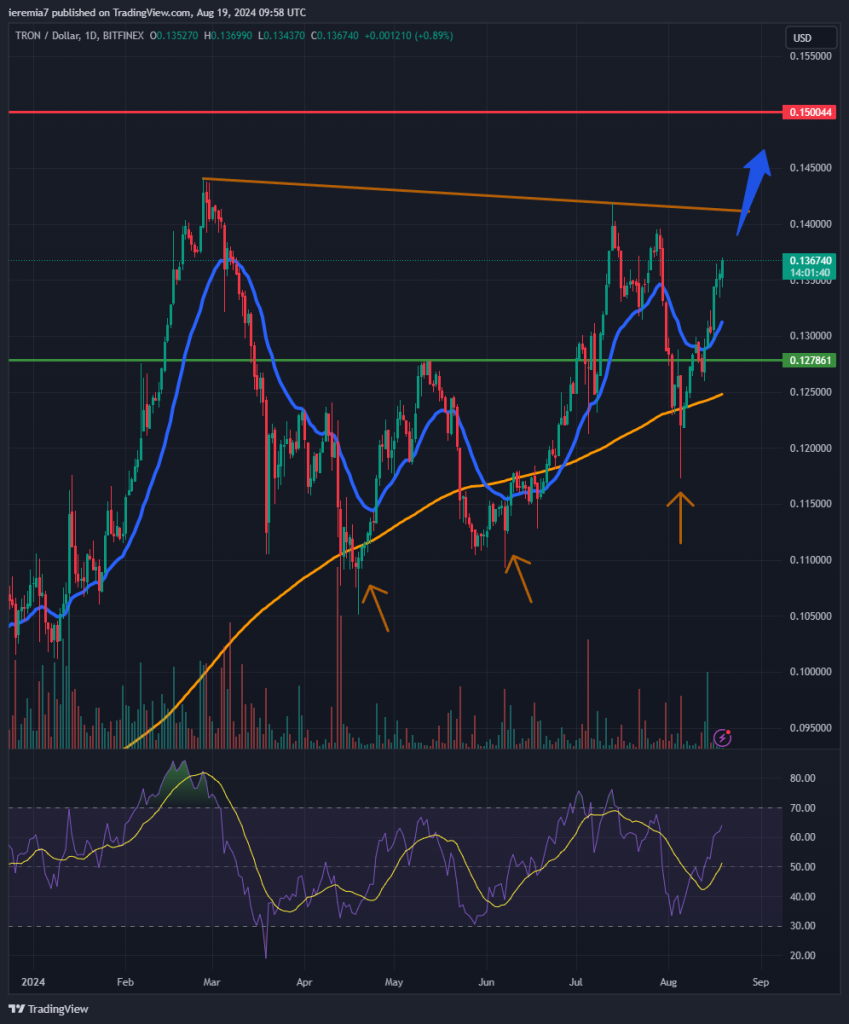
While Bitcoin and Ether are lagging, smaller altcoins post larger daily ranges. This is the case with Tron, which continues to recover from the early August lows. The overall price action structure looks favorable for bulls and we think the coin is on its way to 15 cents, a key resistance level on the chart.
The daily 200 SMA has acted as support several times and you can easily see how impulsively buyers bought the dip each time. This is a sign of confidence and we believe TRX should be able to break above the Feb 2024 high, maybe during the next few days, depending on how the price action unfolds.
Some short-term resistance is expected around 14 cents, but based on the strength of the move up, we don’t advise taking short positions. This is the kind of setup that’s advantageous for buyers, not sellers. Still, if the price drops, we expect support around 13 cents and the daily 200 SMA.


There are no comments at the moment, do you want to add one?
Write a comment