
BTCUSD (Coinbase)
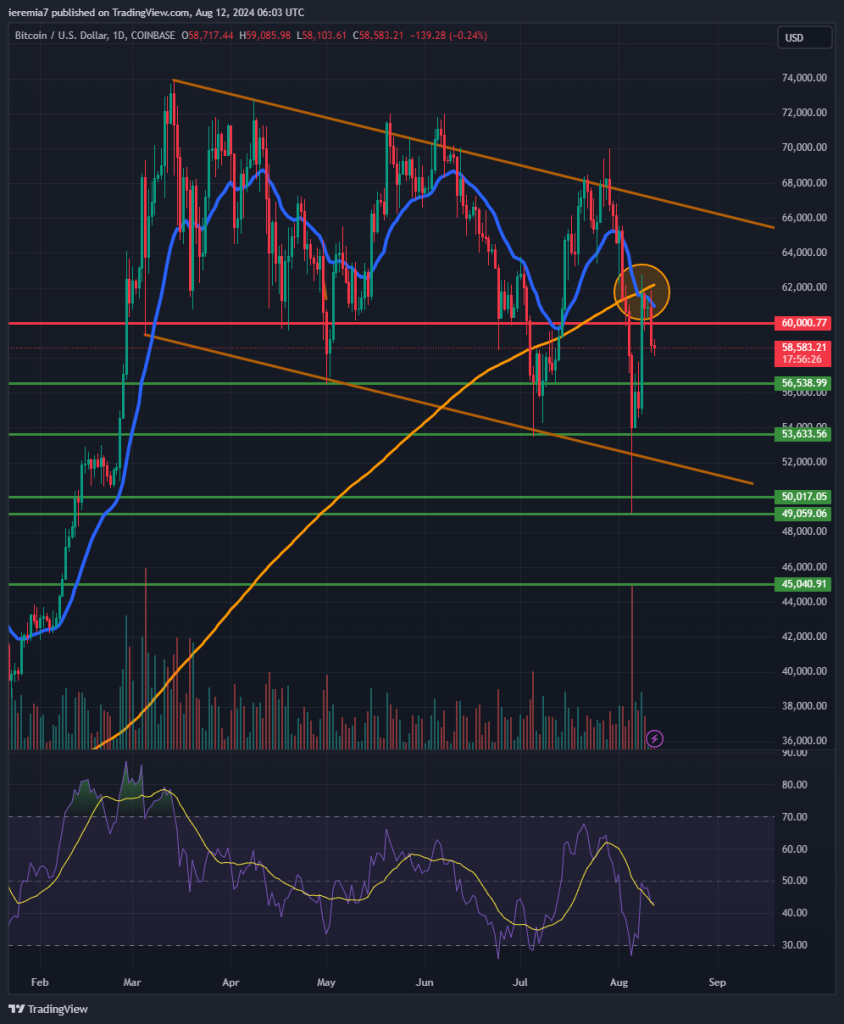
In line with our expectations, Bitcoin did manage to rebound substantially, as risk sentiment stretched on the downside. Although it broke above $60k, the combination of the 20 EMA and 200 SMA on the daily chart turned out to be strong.
The price is now seen retracing lower and the lingering question is what level would be the strongest support. Although we can’t foresee anything, there are some good candidates, including the $56k area and $53.5k.
Naturally, since the price continues trading inside a falling channel formation, the lower bound is the most notable area, especially since it comes close to $50k. In the broader picture, this does look like a large consolidation inside a major bull run. That view holds as long as we don’t continue to see lower lows and lower highs.
Market sentiment will improve substantially if Bitcoin manages to break above the 200 SMA. That’s possible given the RSI is trading around 50, so there is room for bullish momentum to improve. US inflation and Middle East tensions are the main risk events to watch in the upcoming days.
ETHUSD (Kraken)
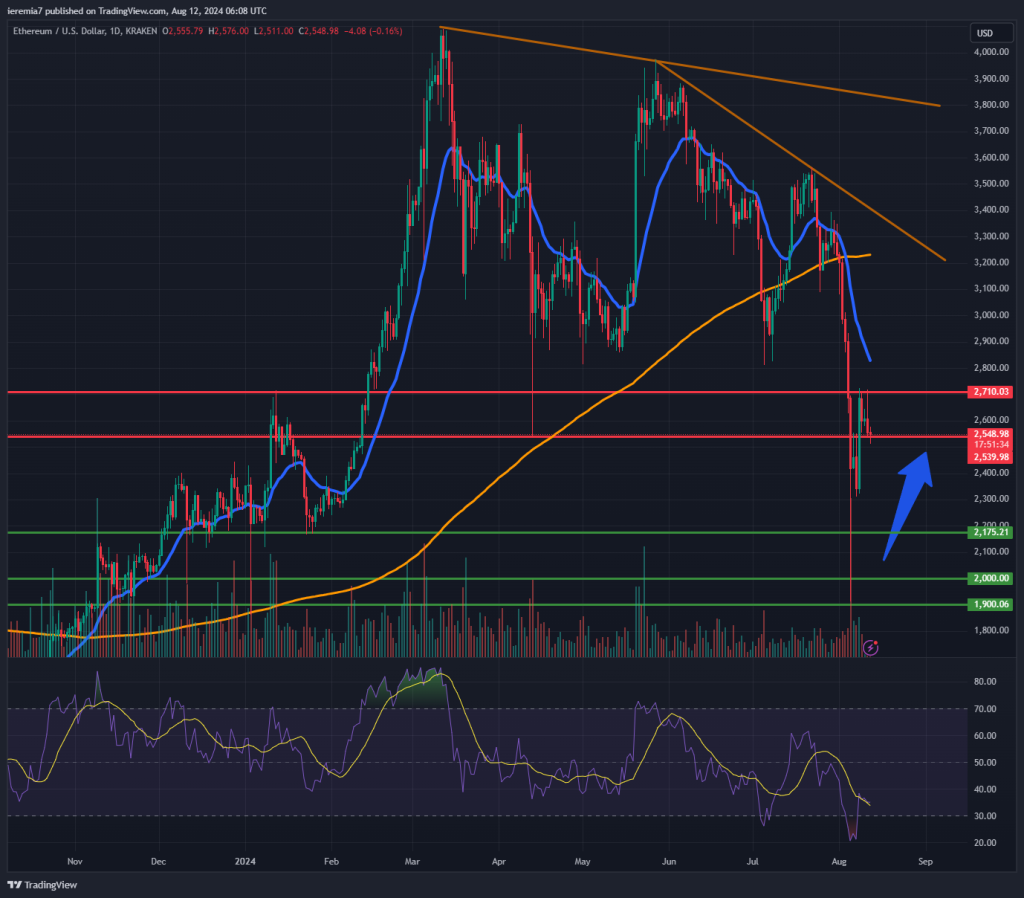
Even though it managed to rebound from the lows, Ether is in a worse technical condition than Bitcoin. We say that because the price is farther away from the daily 200 SMA. As we were anticipating, the $2.7k area is where the rebound stalled and now we wait for further price action clues.
Breaking below the $2,500 area was an important bearish development, given the market managed to blow past an important area. As a result, even if the major selling has stopped, buyers need to be more confident that the bottom is in place.
We expect choppy trading in the week ahead, as the market struggles to find direction. Still, key support and resistance levels should provide plenty of intra-day trading opportunities. We view $2,550 and $2,700 as near-term resistance levels, followed by the daily 20 EMA. On the downside, $2,300 should provide support and if not, the price could slide towards $2,200.
LINKUSD (Kraken)
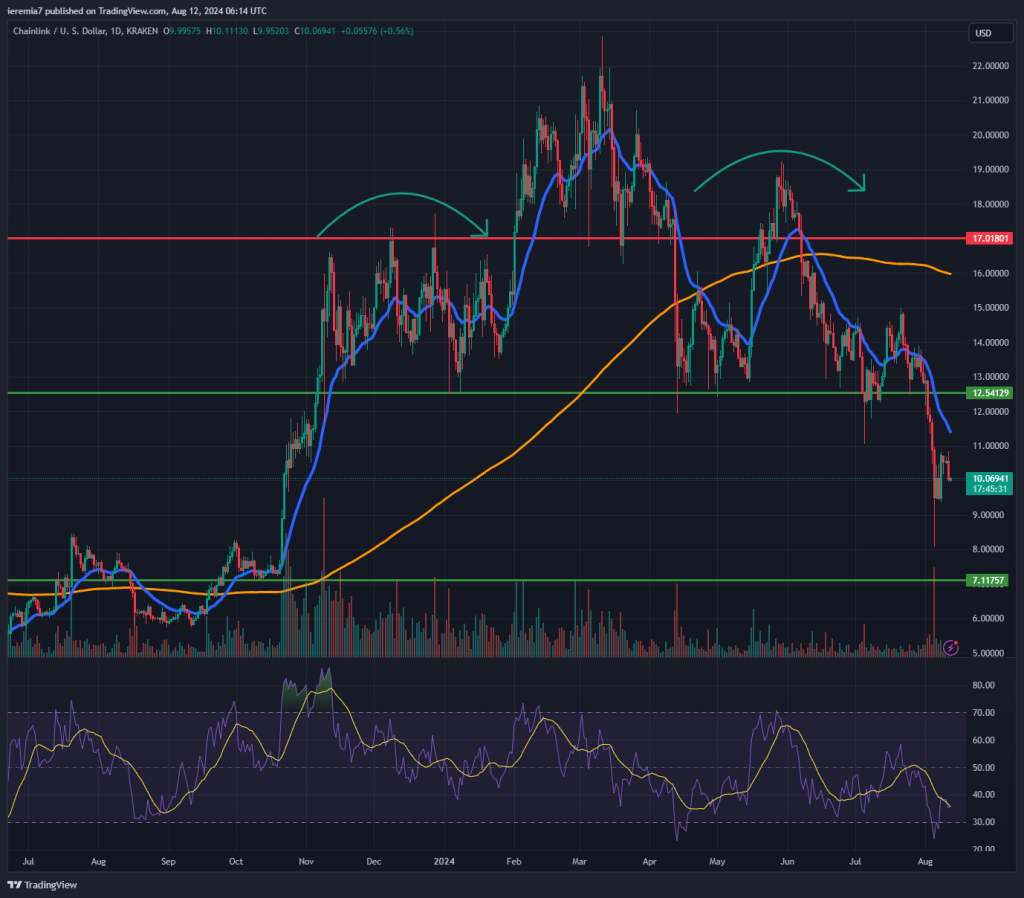
Chainlink had been under heavy pressure for weeks and as we can notice from the daily chart, the coin has formed a nice head and shoulders pattern. LINK broke below the $12.5 neckline on August 2nd and since then there has been nothing to stop sellers from dumping the token.
Buyers need to remain on hold because this isn’t a time to buy, especially if you are looking for short-term plays. We believe there is scope for further selling and the key support area to watch is $7. That’s where stronger buyers should emerge and you need to watch whether volumes improve.
To the upside, the daily 20 EMA and the $11 line should act as resistance, bringing in sellers who want to short the pop. We need to see the price above $12.5 to start thinking that the bearish formation has been negated and LINK is back on the way up. That’s not the case for the time being.


There are no comments at the moment, do you want to add one?
Write a comment