
BTCUSD (Coinbase)
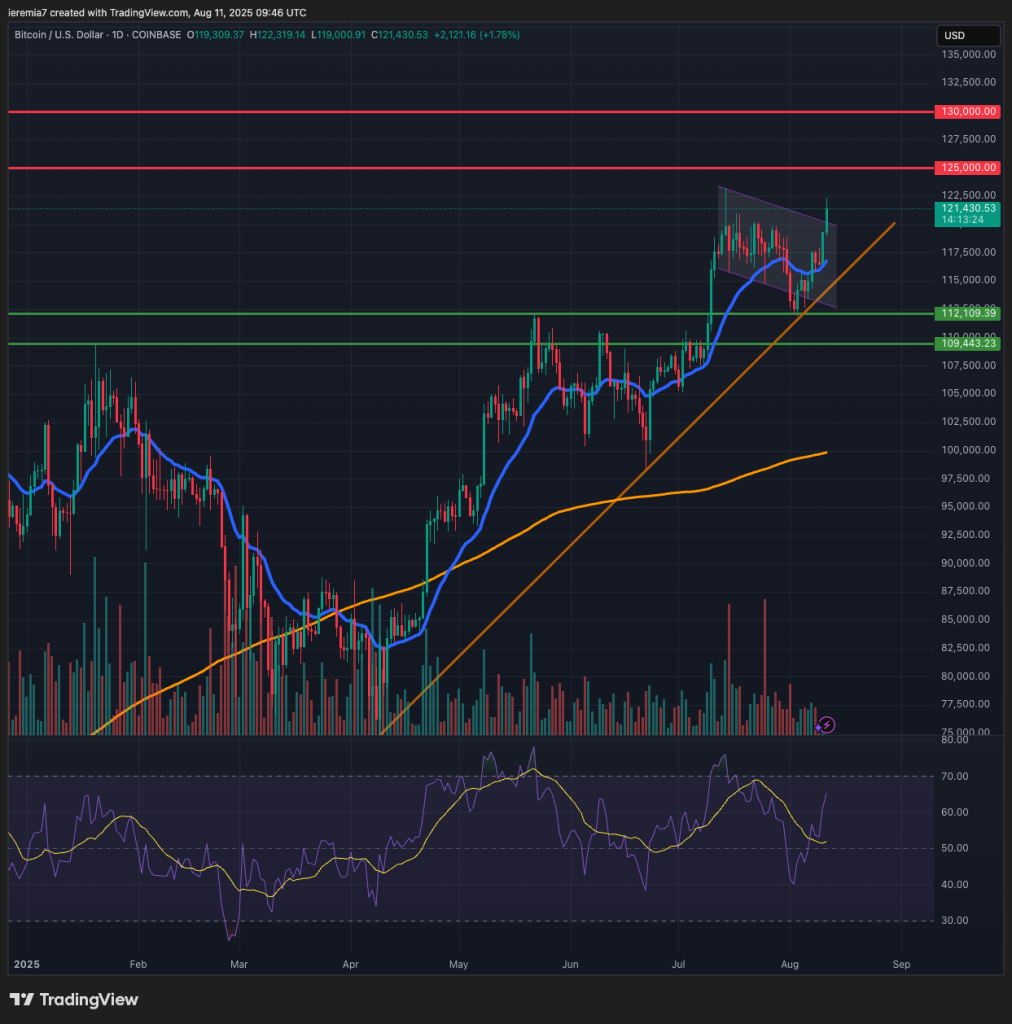
Bitcoin buyers are back in business and we see the price already above our short-term consolidation channel. That puts the ATH under pressure and we might even see a break higher, towards $125, the next important resistance zone. Breaks are usually followed by stronger buying, so it shouldn’t be a surprise if the price continues into $130k, an even stronger resistance.
The US Dollar remains close to the lows of the year and that acts as a tailwind for crypto. At the same time, it’s still summer and in the absence of major headlines, the path of least resistance continues to be up.
While we expect a choppier market starting with the second half of this month, so far there’s no sign of weakness. We should see the price breaking below the daily 20 EMA to suggest sellers are gaining momentum.
But even in that scenario, $112k – $110k remains a key support area. Traders and investors are likely to buy dips, meaning sellers should consider key areas when placing their shorts. We favor the upside this week, as long as the sentiment is not dented by major bearish news.
ETHUSD (Kraken)
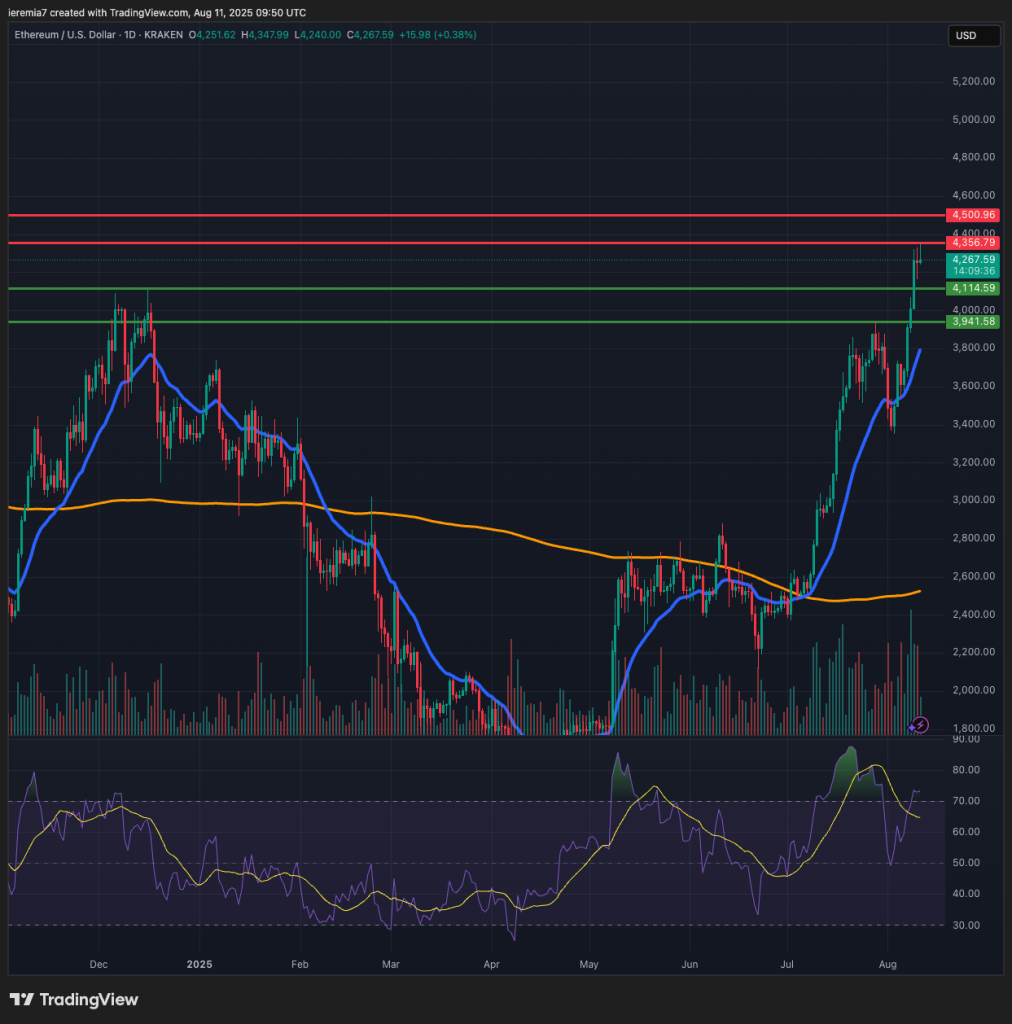
Ether broker above the December 2024 highs and that’s a major bullish development. Ironically, short-selling interest continues to be elevated, despite the massive push we’ve witnessed for the past month.
For that matter, the bullish trend could extend higher, as long as the market will treat the $4,100 – $4,000 area as a role reversal level and support. We think that’s likely and selling into that zone should be a buying opportunity.
On the upside, $4,350 and $4,500 are targets buyers might want to consider. These are levels we haven’t seen since 2021, so at least some market participants should be inclined to take some profits off the table.
As with BTC, we are bullish ETH until an impulsive breakout below the daily 20 EMA takes place. That’s not likely, despite a slight overbought reading on the RSI.
ADAUSD (Binance)
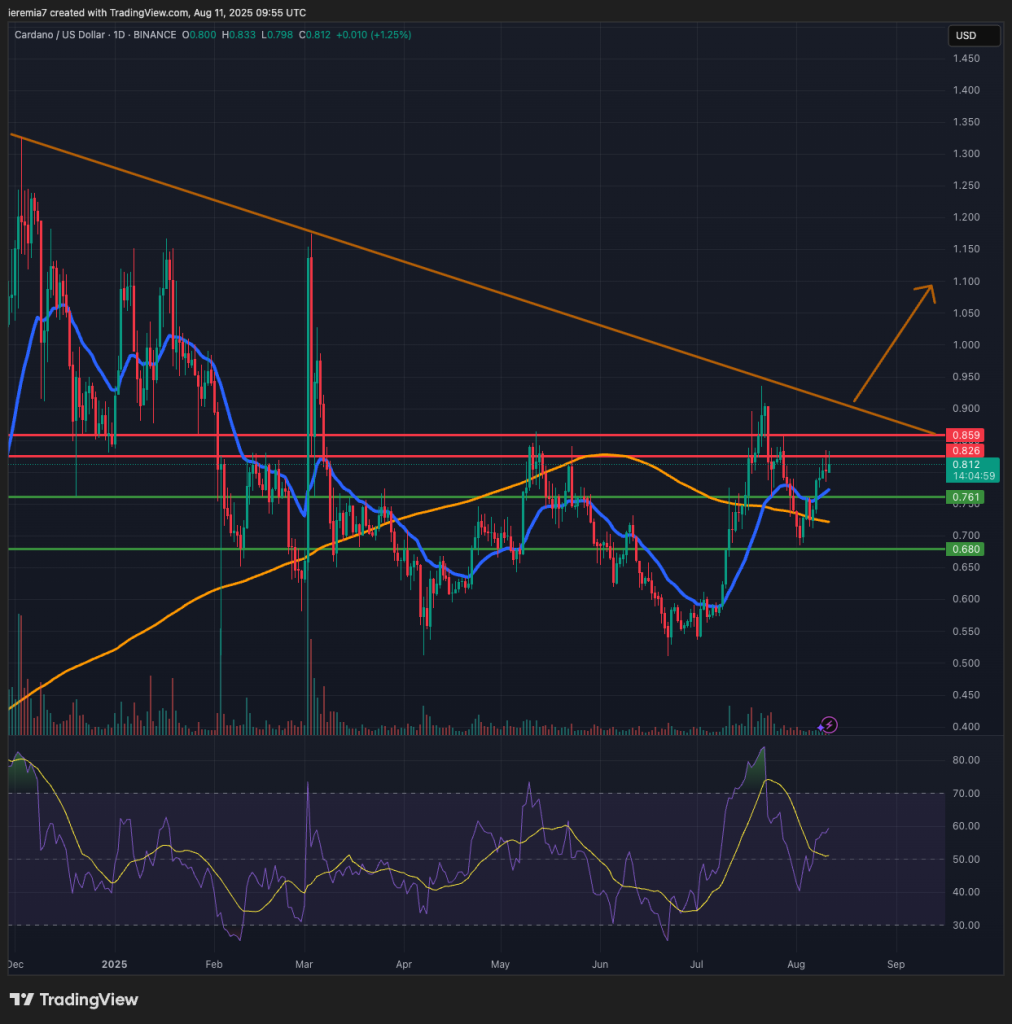
Cardano also moved up last week after treating the daily 200 SMA as a key support zone. The price is now above the 20 EMA as well, which means pressure will mount on 82 cents and 86 cents, two important resistance lines we’ve mentioned in the past.
Additionally, there is a bearish trend line not far above and a breakout above it could spur further buying in this altcoin. As BTC is close to ATHs, flows should shift towards altcoins that have a favorable technical picture.
Based on our chart, Cardano is definitely one of them. Watch how the price action unfolds if the move up extends towards the trend line. Weak selling activity there could mean a break higher might happen soon enough.
If this bullish scenario materializes, ADA could head towards $1.3, which is the December 2024 high. We’ll shift to a bearish stance only if the price breaks below the 68 cents support. That’s the least-likely scenario at this point.


There are no comments at the moment, do you want to add one?
Write a comment