
BTCUSD (Coinbase)
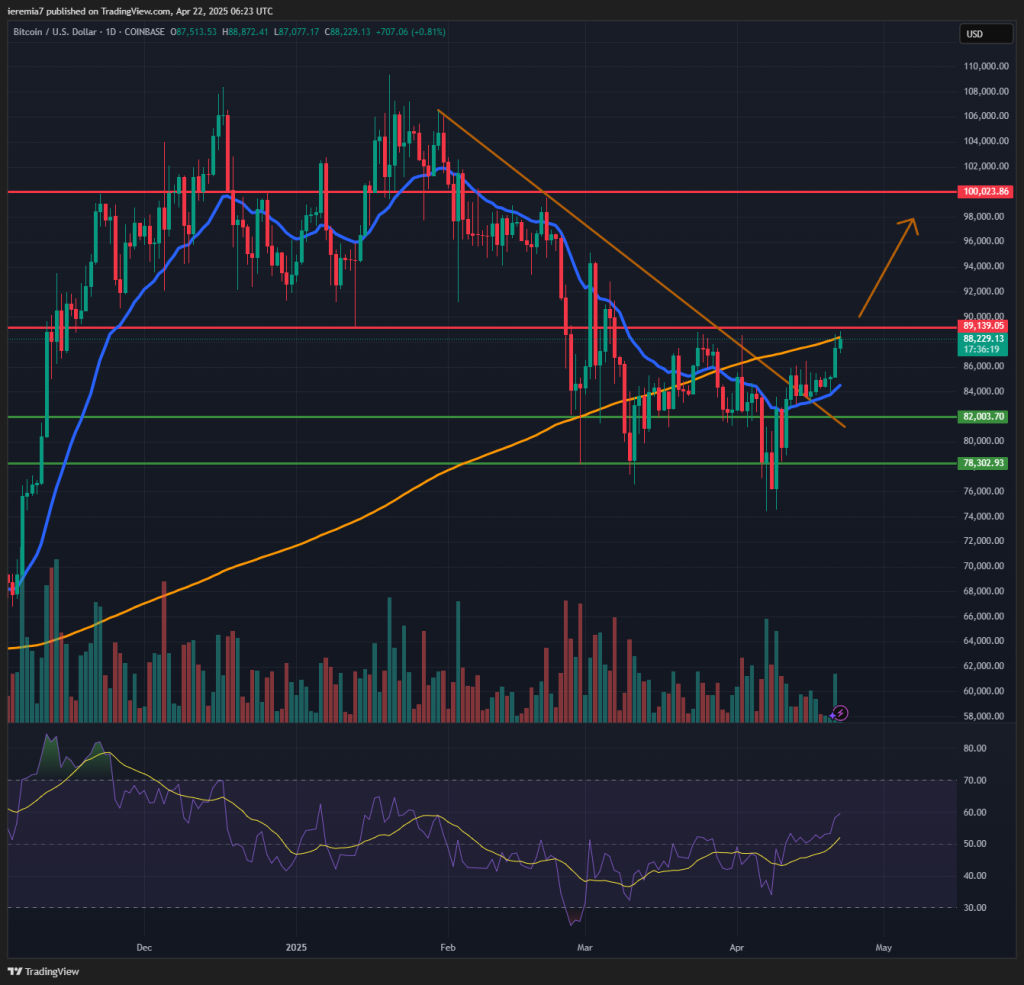
Bitcoin recovery continues on the back of a weaker US Dollar. We see how the price managed to break above our bearish trend, and now buyers are pushing the price into the $89k key resistance level. At the same time, you can easily see the daily 200 SMA is also located there, reinforcing that offer area even more.
As traders get back from the Easter holiday and liquidity improves, we should watch whether BTC manages to break and hold above resistance. If that happens, the picture will get even more bullish and our next upside target will be $100k. Be aware that this market is always vulnerable in the face of negative tariff-related headlines. If major stock markets resume downside impulsively, Bitcoin could weaken in tandem.
Strong selling off the 200 SMA will be a bad sign and one that might incentivise bears further. We’ll look for a pullback towards the 20 EMA or $82k key support. The price action picture has improved meaningfully since last week, but one should be ready for sharp pullbacks along the way, as crypto is highly sensitive to risk aversion.
ETHUSD (Kraken)
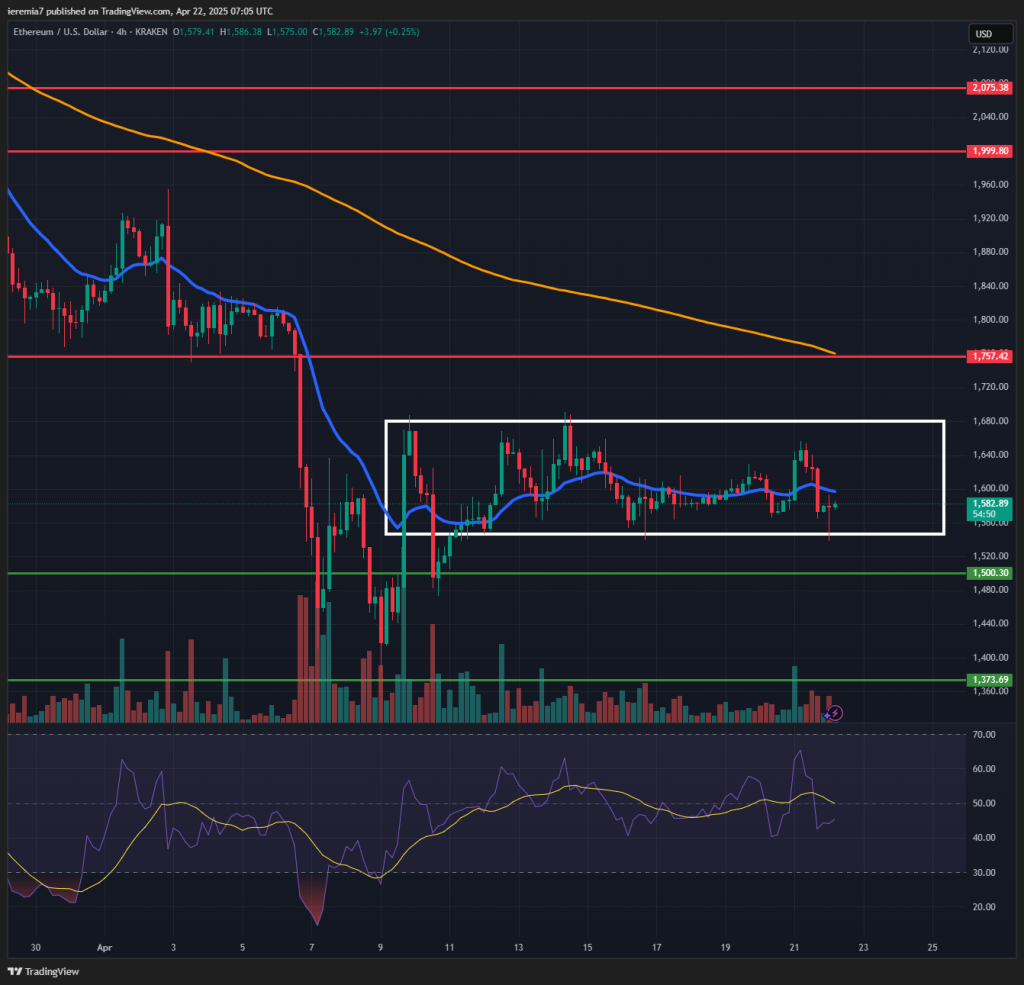
Ether doesn’t show the same bullishness as Bitcoin, suggesting the market enthusiasm is not yet broad-based. We see how the price has been locked inside a range between $1,550 and $1,680. A couple of hours ago, ETH buyers reacted to the lower bound nicely, which means market participants are respecting these levels.
However, the underperformance is a negative sign, considering ETH is more vulnerable if selling intensifies. Below the highlighted range, $1,500 and $1,370 are key support areas to watch. On the upside, breaking above $1,680 means ETH could be poised for a $1,750 retest, which is where the 4h chart 200 SMA is also located.
If BTC sentiment continues to improve, then ETH could follow on the same path, which gives buyers a slight edge. We advise caution since liquidity continues to be thin in this environment.
ADAUSD (Binance)
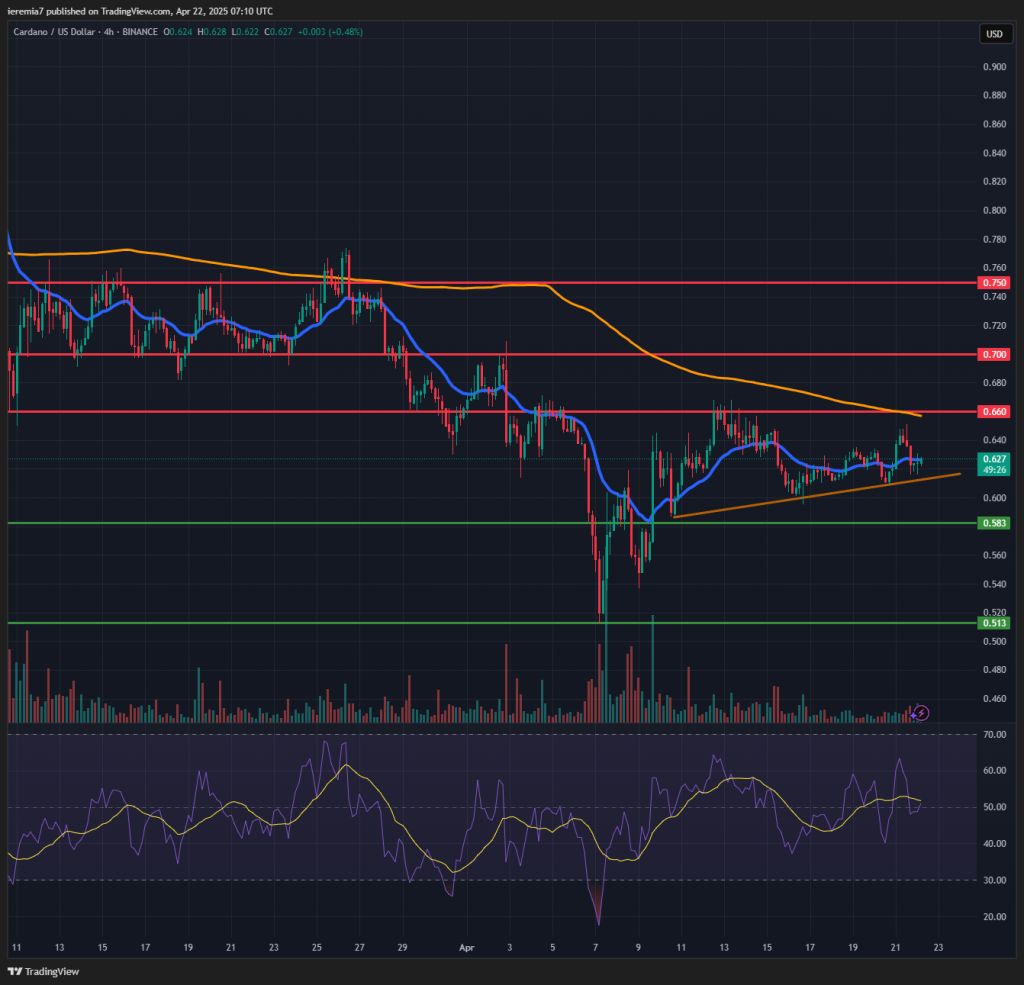
Cardano is choppy, but when looking at the broader picture, this might be a bottoming structure. The buyers are slowly gaining ground and as we move forward, the key test will be breaking above the 66 cents + the 4h chart 200 SMA resistance zone. That will be a positive sign, if it happens and could unlock further upside into 70 and 75 cents.
Weakness below and a break of the trend line on our chart will be bearish and will mean 58 cents should be next as support. We’ll need to see strong selling and continuation to consider a retest of 51 cents, where the market started to rise on April 7th.
After an impulsive move lower, altcoins generally need more time until traders and investors gain confidence again. This pattern seems to repeat itself with ADA right now. Still, barring any major negative news, we give a slight edge to the bullish side. Be aware that all options are on the table.


There are no comments at the moment, do you want to add one?
Write a comment