
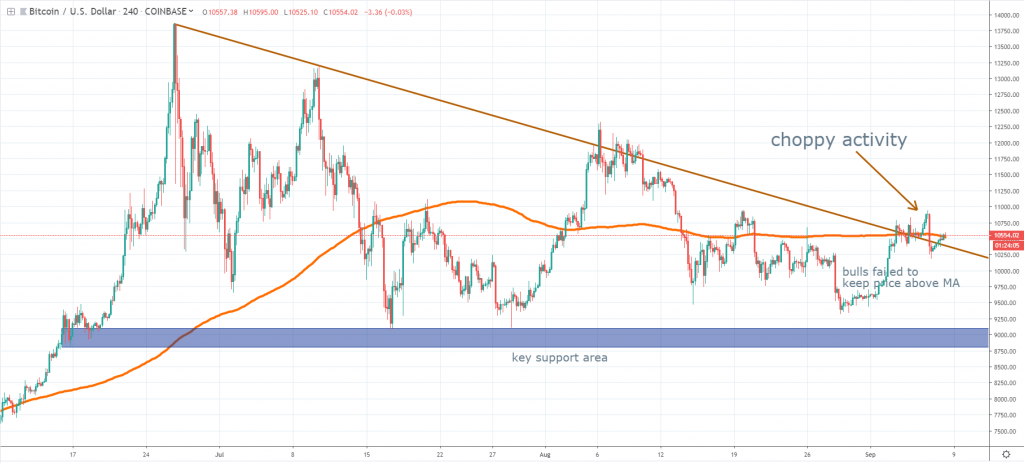
BTCUSD Coinbase
Source: tradingview.com
The Bitcoin price continues to edge higher during the past week but failed around our bearish trend line, where stronger selling emerged again. At the time of writing, we are little above the line, but there seems to be selling interest around the 4h chart 200 MA.
With choppy activity, there is no clear sign on who’s in control over the order flow right now, which means we should wait and see which side will win ultimately. Looking at the bigger picture, we see that the past two selling legs had been weaker and weaker, which may be an encouraging sign for the bulls.
However, we should see which side of the market will manage to dominate. If the price continues up and breaks above $11,000, we should expect more gains towards $12,000. On the other hand, if selling intensifies, we could revisit the key $9,000 area again.
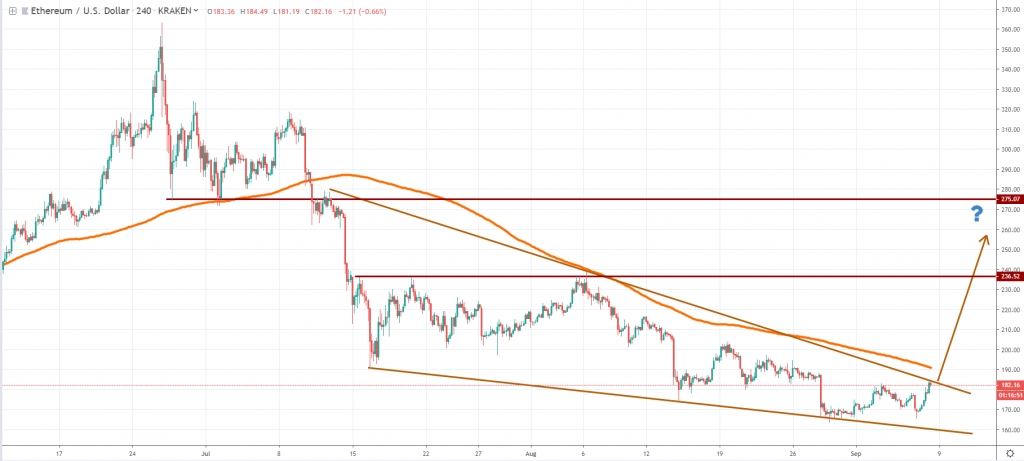
ETHUSD Kraken
Source: tradingview.com
Ether managed to recover slightly and now trades above $180, one of the scenarios which we’ve mentioned in our last weekly crypto analysis. The price action context seems to be signaling a trend reversal is near, given the bearish pennant structure highlighted in our chart.
A breakout above the structure could unlock significant upside potential and we suspect Ether will be edging towards $236 or even $275 during the autumn. This could be another fruitful end of the year for Ether and the other cryptocurrencies, given that the seasonality is on the crypto side during this part of the year.
Only a strong breakout below $160 will negate the fact that we’re already in a transition period and a new bullish leg up could start not too long from now. It will also be important to watch whether buyers will be able to break above the 4h chart 200 moving average.
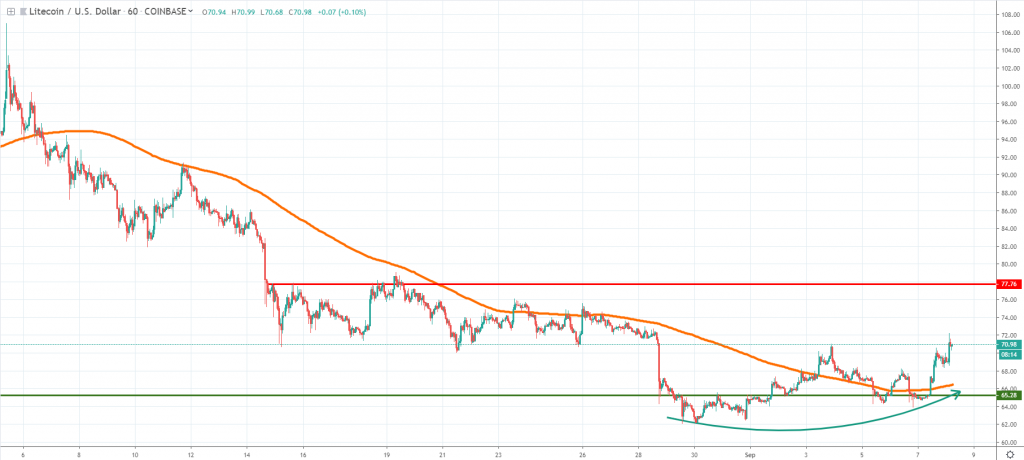
LTCUSD Coinbase
Source: tradingview.com
A week ago, we’ve mentioned that LTC might form a head-and-shoulders pattern on the daily chart, with the neckline around the $65 area. During the past week, the order flow looks to have changed, with buyers already showing signs of strength.
Judging by the latest developments, a bullish parabolic structure could further unfold and keep driving the LTC price higher. We are above the 1h chart 200 moving average since September 7th and since then there wasn’t any significant sign from the sellers.
As a result, we continue to believe that LTC will recover further, with the next intermediate target located around the $77.7 resistance area. Bearish pullbacks are expected to be new opportunities to get long unless the price doesn’t break below the $62 area impulsively. That will negate our bullish view and could signal more downside for LTC.
Briefings about ICOs
The NGS (New Generation Security) ICO will end in one day and six hours, a promising blockchain project which wants to build a network of independent nodes that provide a decentralized encrypted database server.
CazPlus is an IEO that will start in seven days, which uses a combination between blockchain, Fintech, and Artificial Intelligence, in order to develop various products and services that include an e-commerce marketplace, payments gateways, a cryptocurrency exchange and others.


There are no comments at the moment, do you want to add one?
Write a comment