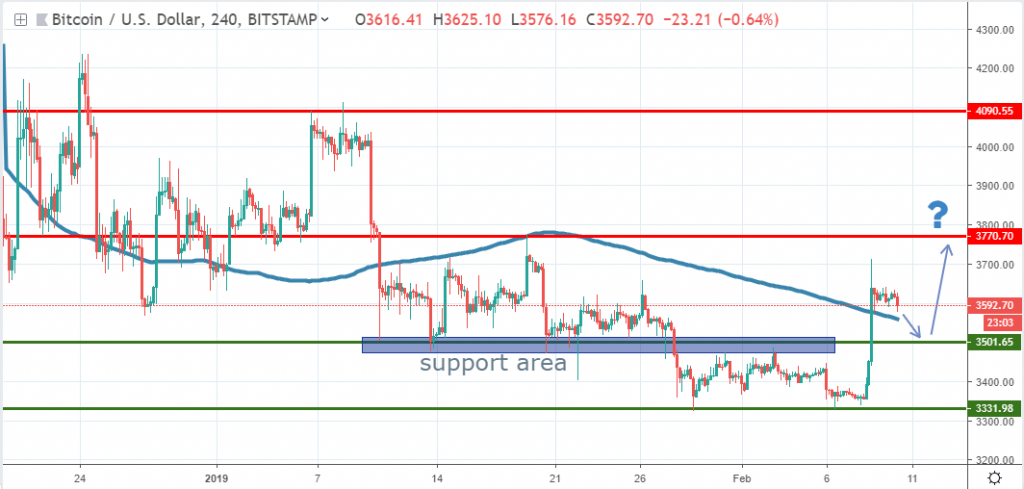
BTCUSD-Bitstamp

Source: tradingview.com
Although the first part of the week started with more selling pressure, since February 8th, the Bitcoin price managed to stage an impressive recovery, managing to bank an approximately 10% gain, top tick to bottom tick.
Despite the fact we are now little above the 4h chart 200 moving average (which is an indication that bulls are in control short-term) we see no follow-through buying, which puts a continuation higher under question. We expect support around the MA and if that won’t happen, the next to follow is the 3,500 psychological area. Further losses below it will confirm that this was just another small scale pump and dump scheme.
On the other hand, if buyers will manage to defend either the MA or the psychological level, we could see a continuation higher, probably towards 3,770 or even 4,000. We haven’t breached the 2018 low yet, so we might still be in a bottoming process, which is good news for buyers.
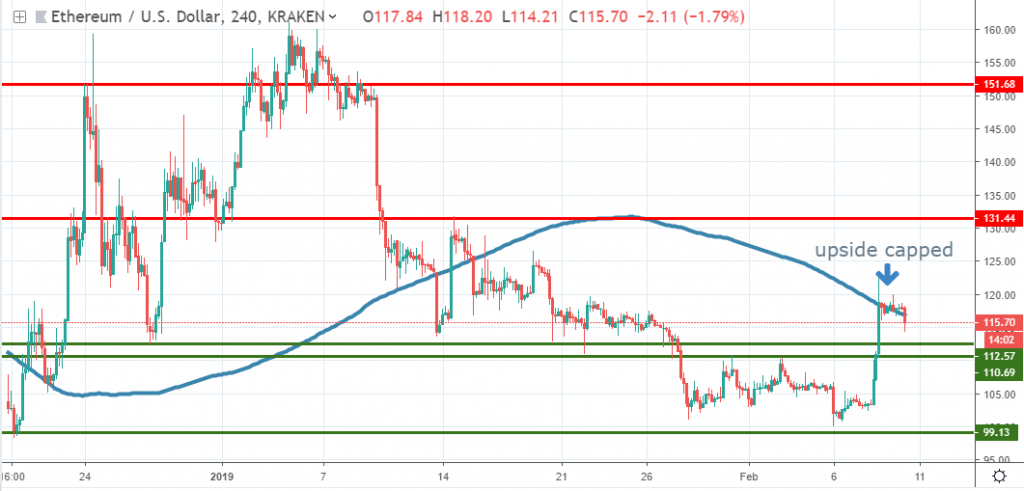
ETHUSD-Kraken

Source: tradingview.com
As the positive sentiment spread across the market, Ether had also started to edge higher, before even touching our $99 support level. However, one negative aspect about this short-term surge is the fact that it was capped by the 4h chart 200 moving average, which means that sellers might still be eager to jump in on rallies.
We could see some further weakness in the near term, with the $110.6-$112.5 support area as the next demand zone. If buyers won’t be able to defend it, then the likelihood of the price hitting the $99 support are much greater.
On the other hand, if buyers will drive the price action above the MA, resistance is expected at around $131. If that will happen, we think a bigger movement might be under the horizon, with the next target located around $150-$151 area.
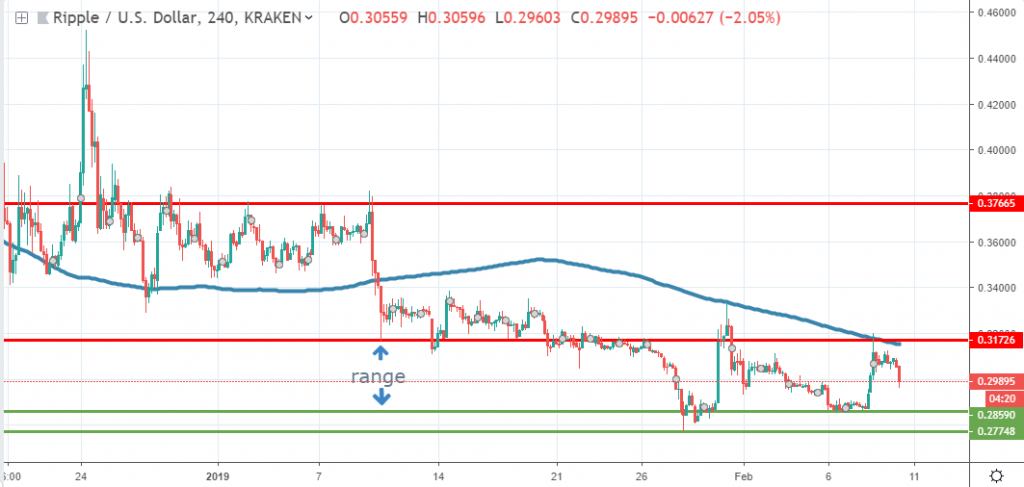
XRPUSD-Kraken

Source: tradingview.com
Since the end of January, XRP had been locked in a range formed by the 31.7 cents roof and 28.5-27.7 cents floor. The surge in all cryptocurrencies we’ve seen in the last three days was not strong enough to push XRP outside the range.
What’s even more interesting to note is the weakening bullish legs, which communicates from an order flow perspective that buyers are weaker and weaker. The roof of the range combined with the 4h chart 200 MA formed a strong resistance zone, were sellers accumulated enough and now the price is around the middle of the range.
Given the weakening bullish interest, we estimate there’s around 60% chance of a downside breakout and a continuation towards 25 cents, where the next significant demand zone is located.
On the other hand, if buyers will defend successfully the floor, a new surge towards 31.7 cents is the most likely scenario.
Briefings about ICOs
On February 14th, the WOM project will end its ICO, which is another blockchain-based company wanting to revolutionize the advertising industry. The WOM protocol and token represent a simple and transparent means for rewarding peer-to-peer recommendations in a scalable and robust economy, leveraging the power of blockchain.
In terms of upcoming ICOs, MinedBlock will start raising funds on February 15th. It represents a project that enables investors to buy an ST20 Security Token, which will then benefit from the revenue generated by a mining farm. The ICO will last until May 31st.


There are no comments at the moment, do you want to add one?
Write a comment